In today's digital-first economy, the health, performance, and security of your IT infrastructure are directly tied to business success. Downtime isn't just an inconvenience; it's a direct hit to revenue, customer trust, and operational efficiency. This is where IT infrastructure monitoring tools transform from a 'nice-to-have' into a core business necessity. Proactive monitoring allows organisations to move from a reactive, fire-fighting mode to a predictive and optimised state.
By gaining real-time visibility into every layer of the stack, from servers and networks to applications and cloud services, teams can anticipate issues before they escalate. This foresight helps to optimise resource allocation and ensure seamless service delivery. The fundamental challenge these platforms solve is shifting your operations from costly, reactive problem-solving to proactive, strategic management. This guide is designed to help you navigate the crowded market of monitoring solutions.
We will provide a practical, in-depth analysis of the leading tools available today, including Datadog, Zabbix, Site24x7, and PRTG Network Monitor. For each platform, we will move beyond the marketing claims to explore:
- Real-world use cases: Understand where each tool truly excels.
- Honest limitations: Acknowledge potential drawbacks to avoid surprises.
- Key feature analysis: Pinpoint the functionalities that matter most.
- Implementation insights: Get a clear idea of setup and integration efforts.
This curated list offers a straightforward comparison, complete with screenshots and direct links, to help you find the best of the many IT infrastructure monitoring tools for your specific needs. Whether you are a startup building your first environment or an enterprise managing a complex, hybrid cloud, this resource will equip you with the knowledge to make an informed decision.
1. Cloud Security Monitoring
Signiance Technologies' Cloud Security Monitoring service earns our featured choice spot by offering a highly specialised and proactive solution focused squarely on securing cloud environments. Rather than being just another general-purpose infrastructure tool, its strength lies in its deep integration with cloud-native principles, particularly the AWS Well-Architected Framework. This focus ensures that monitoring isn't an afterthought but a core component of a resilient and secure cloud architecture, making it one of the most strategic IT infrastructure monitoring tools for cloud-first organisations.
The service excels in providing real-time threat detection, allowing security teams to identify and neutralise incidents as they unfold, thereby drastically reducing potential impact. This capability moves beyond simple alerting to provide actionable intelligence, a critical differentiator in today's fast-paced threat landscape. For businesses navigating complex regulatory environments, its continuous compliance monitoring automates the arduous task of staying aligned with standards like PCI DSS or GDPR.
Comprehensive Analysis and Use Cases
What truly sets this service apart is its holistic approach. It combines several critical security functions into a cohesive service, offering more than just passive observation.
- Real-Time Threat Detection: By analysing event streams and system behaviour in real time, the service can immediately flag suspicious activities. For example, it can detect an unauthorised API call attempting to escalate privileges or a sudden data exfiltration attempt from an S3 bucket, triggering an immediate alert for the incident response team.
- Deep Log Analysis: The platform ingests and correlates logs from various cloud services (e.g., AWS CloudTrail, VPC Flow Logs). This allows it to uncover subtle, low-and-slow attacks or anomalous user behaviour that might otherwise go unnoticed, providing a comprehensive security overview.
- Continuous Compliance & Configuration Management: It continuously scans cloud configurations against established security benchmarks and compliance mandates. This function is invaluable for preventing configuration drift, a common source of security breaches. For instance, it can automatically detect if a security group has been improperly configured to allow unrestricted public access, enabling teams to remediate it before it can be exploited.
For a deeper dive into its capabilities, you can explore the service page and learn more about Cloud Security Monitoring from Signiance.
Practical Considerations
Best For: Enterprises, startups, and DevOps teams who operate primarily within the AWS ecosystem and prioritise a security-first approach to their cloud infrastructure. It is particularly effective for organisations that need to maintain stringent compliance and want to leverage expert-driven monitoring without building a large in-house security operations centre (SOC).
| Feature Evaluation | Assessment |
|---|---|
| Real-Time Detection | Excellent: Enables swift incident response, a key factor in minimising breach impact. |
| Log Analysis | Very Good: Uncovers hidden threats by correlating data across multiple sources. |
| Compliance Automation | Excellent: Reduces the manual effort and risk associated with regulatory adherence. |
| Integration | Good: While powerful, integration complexity can vary based on existing toolchains. |
Pros:
- Proactive, real-time threat detection for immediate incident response.
- In-depth log analysis helps identify complex and hidden security vulnerabilities.
- Continuous compliance monitoring simplifies adherence to industry regulations.
- Backed by Signiance's deep expertise in cloud security and the AWS Well-Architected Framework.
Cons:
- Effectiveness is highly dependent on well-configured data inputs and logging.
- May require significant integration effort depending on the complexity of the existing cloud environment.
2. Datadog
Datadog is a formidable, all-in-one observability platform that excels at unifying metrics, traces, and logs from your entire technology stack. It's a go-to choice for organisations that operate in complex, hybrid environments, offering a single pane of glass for everything from on-premises servers to cloud-native microservices. What truly distinguishes Datadog among other IT infrastructure monitoring tools is its sheer breadth of integrations, boasting over 700 pre-built connections that make data ingestion seamless.
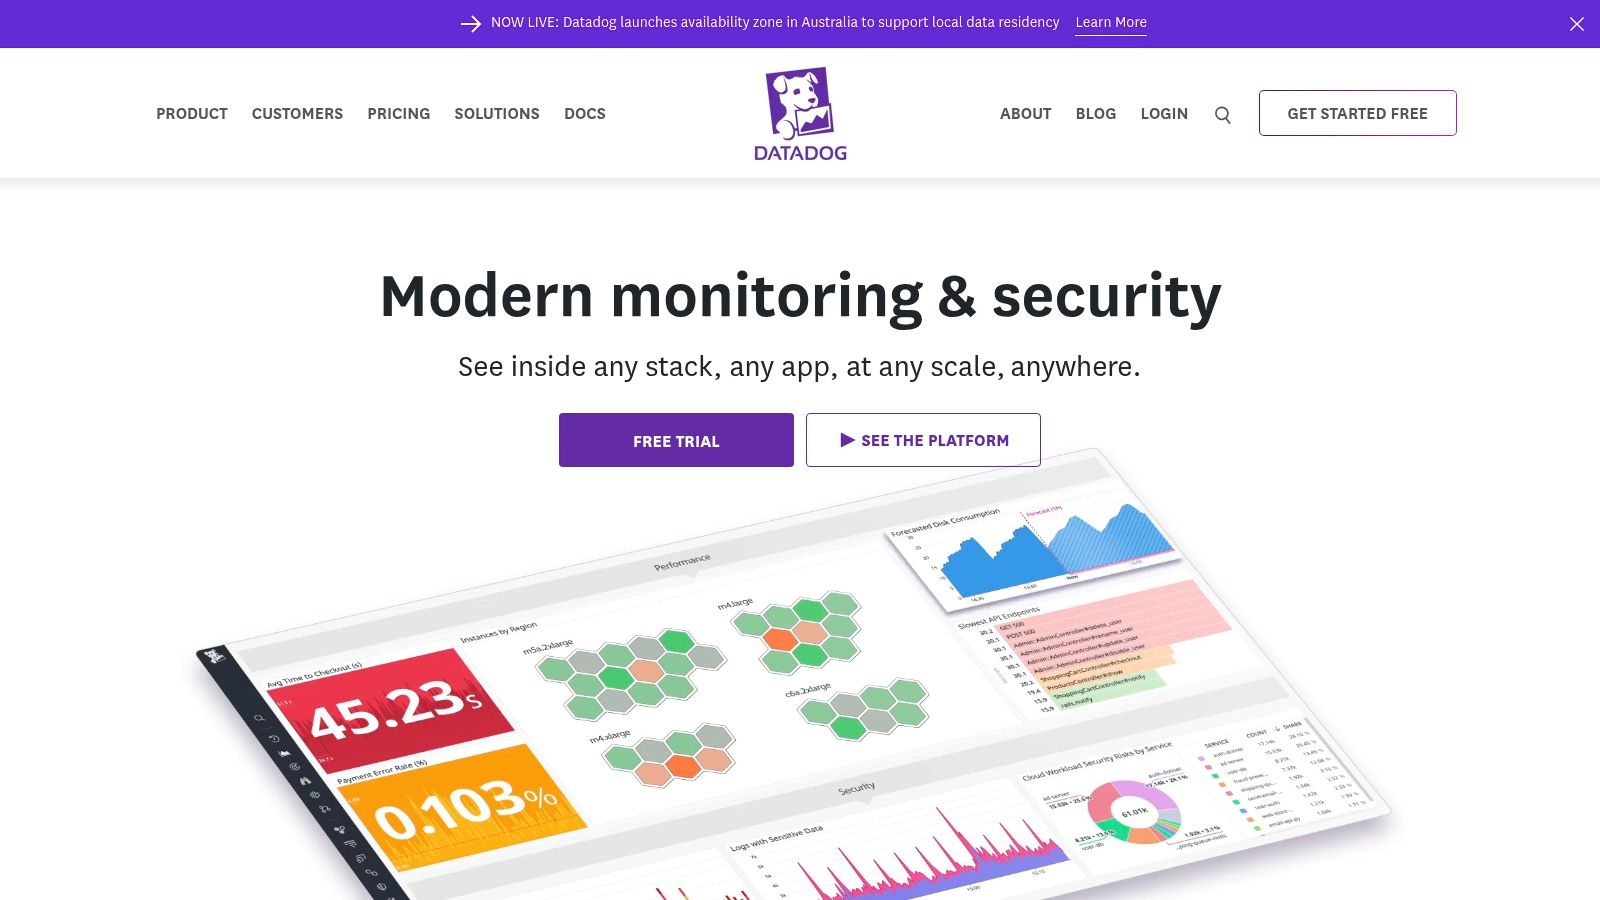
This extensive support allows DevOps and IT teams to correlate performance issues across disparate systems with remarkable ease, significantly reducing mean time to resolution (MTTR). The platform's highly customisable dashboards are another standout feature, empowering different teams to create bespoke views tailored to their specific needs, from high-level business KPIs to granular infrastructure health checks.
Analysis & Key Considerations
- Best Use Case: Ideal for mid-sized to large enterprises with hybrid or multi-cloud environments requiring a unified view of their infrastructure and applications.
- User Experience: The interface is powerful but can present a steep learning curve for newcomers. Once mastered, its drag-and-drop dashboards and intuitive data exploration are highly effective.
- Pricing Structure: Datadog operates on a modular, per-host, or per-gigabyte pricing model. While this offers flexibility to start small, costs can escalate quickly as your infrastructure grows, so careful monitoring of usage is crucial. A 14-day free trial is available to explore its full capabilities.
- Limitations: The primary drawback is its cost at scale. The comprehensive feature set, while a strength, can also be overwhelming for smaller teams with simpler monitoring needs.
Website: https://www.datadoghq.com/
3. Zabbix
Zabbix stands out as a powerful, enterprise-ready, and entirely open-source monitoring solution. It provides a highly flexible and scalable framework for keeping an eye on everything from network devices and servers to cloud services and applications. What truly sets Zabbix apart in the landscape of IT infrastructure monitoring tools is its zero-cost entry point combined with an extensive, enterprise-grade feature set, making it an incredibly cost-effective choice for organisations of any size.
The platform’s strength lies in its limitless customisation. Teams can configure complex alert triggers, build detailed graphical visualisations, and leverage its robust API for seamless integration into existing workflows. Backed by a strong global community and comprehensive official documentation, Zabbix empowers IT teams to build a monitoring environment perfectly tailored to their specific infrastructure needs without being locked into a proprietary ecosystem.
Analysis & Key Considerations
- Best Use Case: Perfect for businesses of all sizes, from startups to large enterprises, that need a powerful, customisable, and budget-friendly monitoring solution and have the technical expertise to manage the initial setup.
- User Experience: While extremely powerful, the user interface can feel somewhat dated and less intuitive compared to modern SaaS platforms. The initial setup and configuration process can be complex and may present a steep learning curve for beginners.
- Pricing Structure: Zabbix is completely free and open-source. Costs are only associated with the underlying hardware it runs on and any optional professional training or support services purchased directly from Zabbix or third-party consultants.
- Limitations: The primary drawback is the complexity of its initial deployment and configuration. The UI, while functional, lacks the polished feel of its commercial competitors, which might hinder adoption by less technical users.
Website: https://www.zabbix.com/
4. Site24x7
Site24x7, from Zoho Corporation, presents a powerful, all-in-one monitoring solution designed for accessibility and comprehensive coverage. It capably observes everything from websites and servers to applications and network devices, catering to both on-premises and cloud infrastructures. A key differentiator is its automated discovery and mapping functionality, which simplifies the onboarding of network devices and provides immediate visibility into your IT environment. This makes it one of the more user-friendly IT infrastructure monitoring tools for teams needing to get up and running quickly.
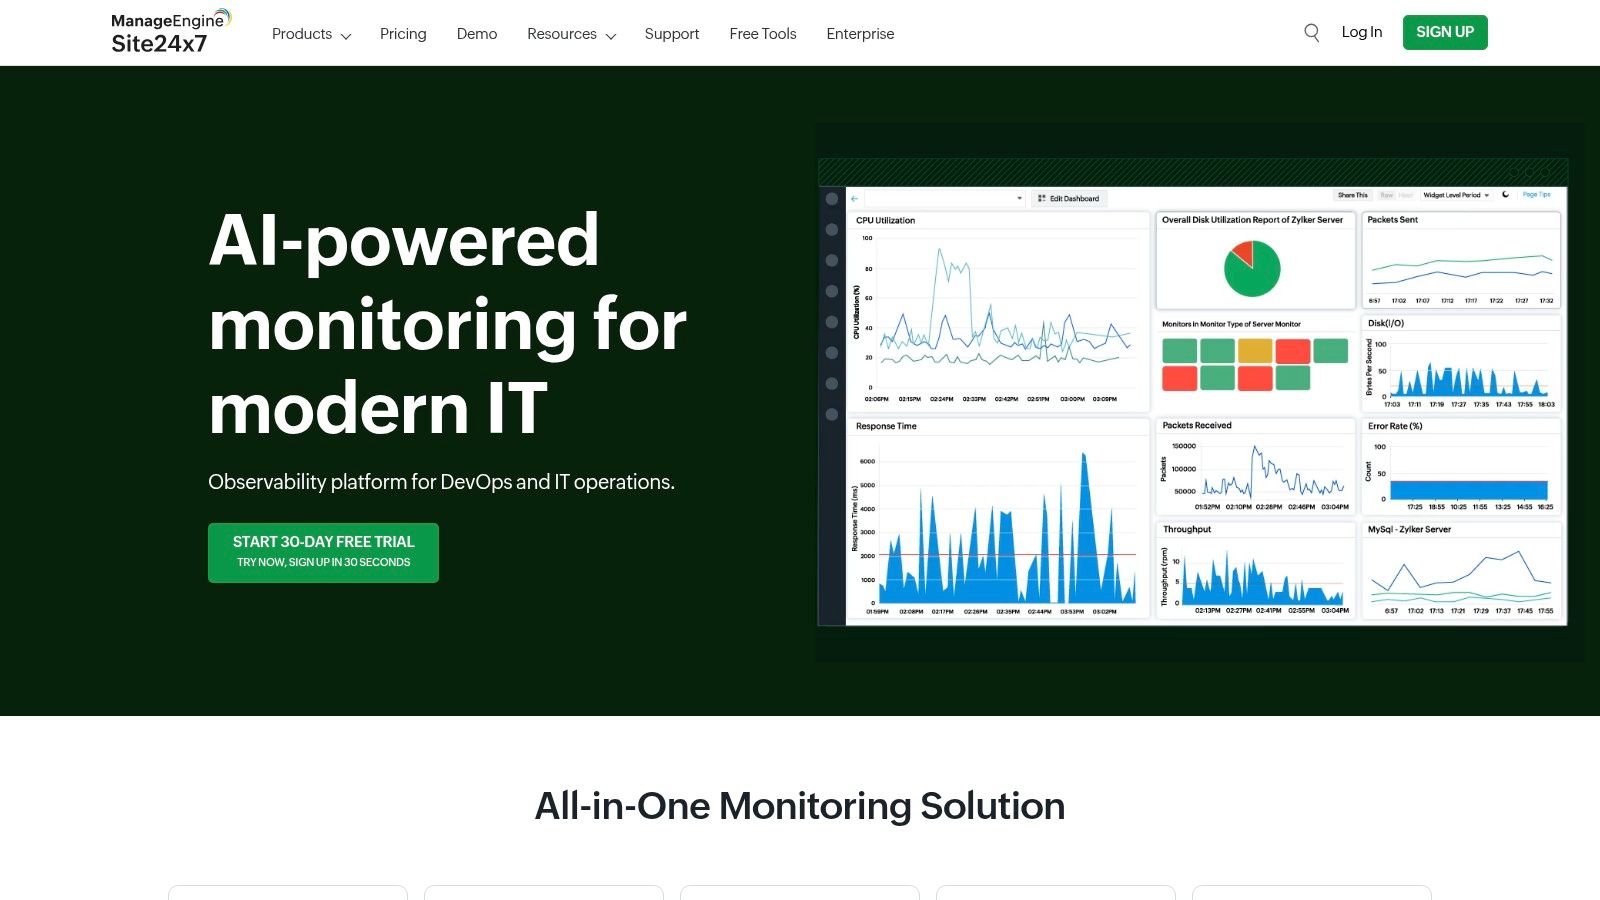
The platform provides full observability, allowing DevOps, SREs, and IT professionals to correlate performance data across the entire stack. Furthermore, Site24x7 stands out by offering an extensive collection of over 50 free tools for network analysis, DevOps tasks, and site reliability engineering, adding significant value beyond its core paid offerings. This commitment to providing free resources makes it a compelling option for organisations of all sizes.
Analysis & Key Considerations
- Best Use Case: Excellent for small to mid-sized businesses (SMBs) and enterprises seeking a comprehensive, yet cost-effective monitoring solution with minimal setup complexity.
- User Experience: The interface is generally intuitive and well-organised, making it easier to navigate than some more complex enterprise tools. The automated discovery features greatly enhance the initial setup experience.
- Pricing Structure: Site24x7 offers a very flexible and transparent pricing model with various plans and numerous add-ons. This allows you to customise a subscription that fits your specific needs without paying for unnecessary features. A 30-day free trial is available.
- Limitations: While powerful, some of the most advanced enterprise-grade features may be reserved for higher-tier plans. The initial configuration, although aided by automation, can still require a time investment to tailor it perfectly to a complex infrastructure.
Website: https://www.site24x7.com/
5. PRTG Network Monitor
PRTG Network Monitor by Paessler is a robust, sensor-based solution that provides deep visibility into your network infrastructure and connected devices. It stands out in the crowded market of IT infrastructure monitoring tools by offering an "all-in-one" package where all features are included in every licence, avoiding complex modular pricing. This approach makes it a favourite among IT administrators who require comprehensive monitoring without needing to purchase multiple add-ons.
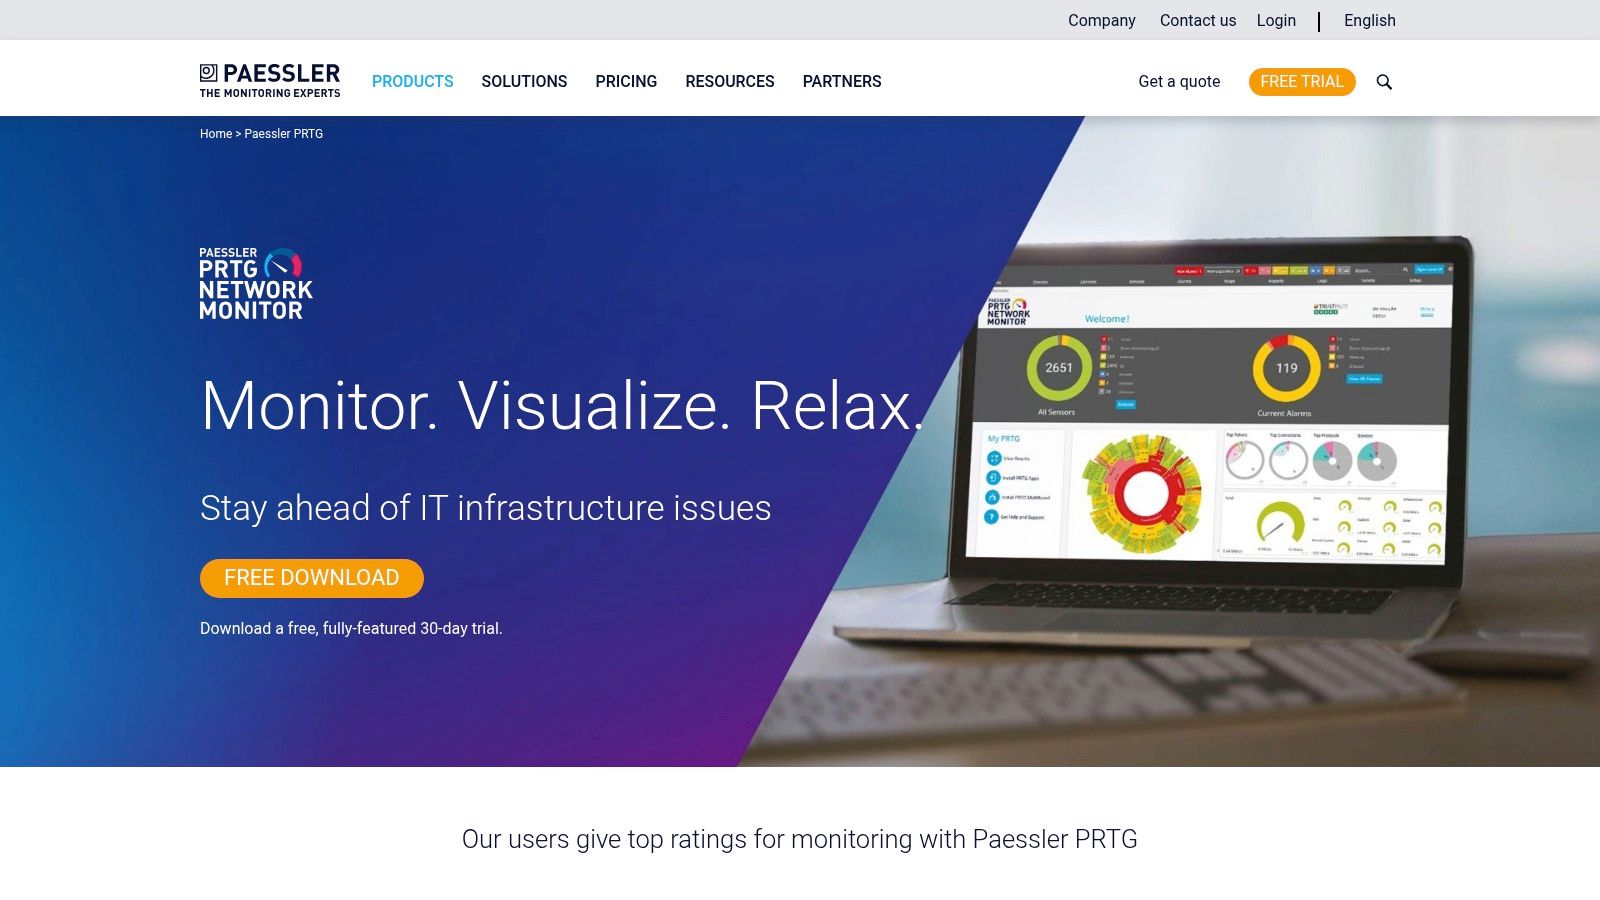
The platform's strength lies in its over 300 pre-configured sensors, which can monitor everything from network traffic via SNMP and WMI to application performance and virtualised environments. Its highly customisable dashboards, built with a drag-and-drop editor, allow teams to create specific views that map directly to their operational priorities. The inclusion of cluster failover capabilities also ensures high availability, a critical requirement for continuous business operations.
Analysis & Key Considerations
- Best Use Case: Suited for organisations of all sizes, from SMBs to large enterprises, that prioritise detailed network and on-premises infrastructure health monitoring.
- User Experience: The interface is powerful and feature-rich, though the initial setup and configuration can be complex and may require a degree of technical expertise to fully leverage its capabilities.
- Pricing Structure: PRTG uses a perpetual, sensor-based licensing model. A free version is available for up to 100 sensors, making it accessible for small environments. For larger deployments, the cost is determined by the number of sensors required, which can become expensive at scale.
- Limitations: The primary focus is heavily on network and infrastructure monitoring, so it may lack the depth in application performance monitoring (APM) and log management found in broader observability platforms. Its pricing can be a significant investment for large-scale infrastructures.
Website: https://www.paessler.com/prtg
6. Nagios XI
Nagios XI is a powerful, long-standing player in the IT monitoring space, built upon the incredibly versatile Nagios Core engine. It offers comprehensive monitoring of servers, applications, and network infrastructure, providing organisations with a centralised view of their entire IT estate. What sets Nagios XI apart is its unparalleled flexibility and extensibility, driven by a massive community and a vast library of thousands of plugins. This makes it one of the most customisable IT infrastructure monitoring tools available, capable of monitoring practically any device or service imaginable.
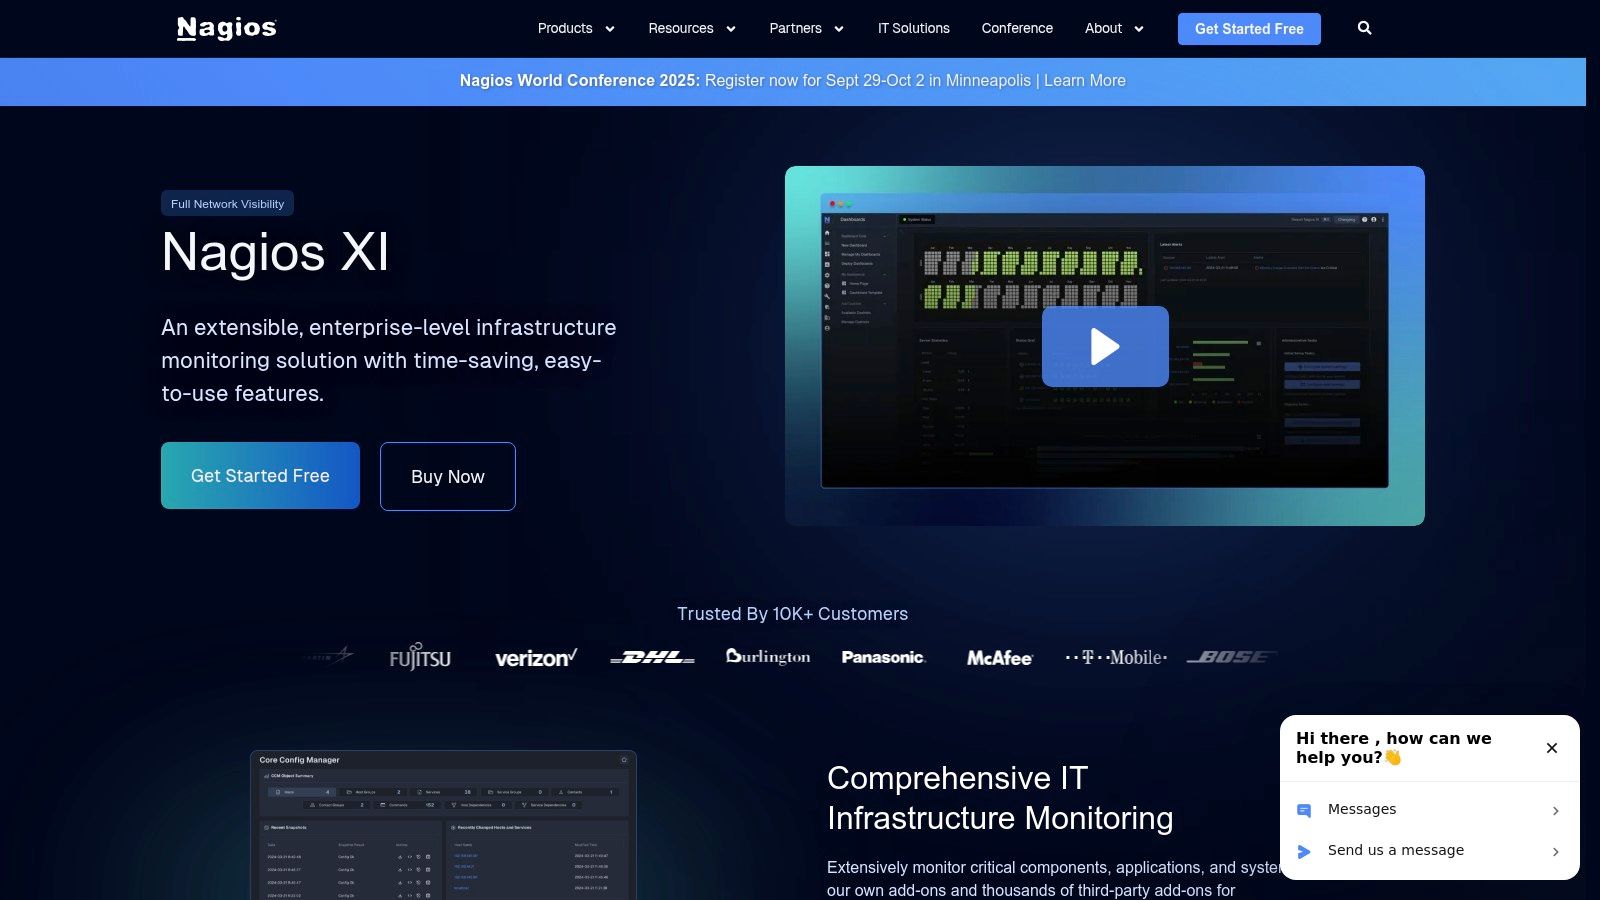
This extensive plugin ecosystem allows IT teams to tailor the tool precisely to their environment, whether it's a simple server room or a complex, distributed network. The platform features a user-friendly web interface with customisable dashboards, configuration wizards, and advanced reporting capabilities, simplifying the management of what can be a highly complex monitoring setup.
Analysis & Key Considerations
- Best Use Case: Ideal for organisations of all sizes that require deep customisation and have the technical expertise to leverage its powerful, plugin-based architecture.
- User Experience: While the web interface is functional and a significant improvement over Nagios Core, it can feel dated compared to more modern UIs. The initial setup and configuration can be complex, especially for those new to the Nagios ecosystem.
- Pricing Structure: Nagios XI is offered in two editions: Standard and Enterprise. Pricing is based on the number of nodes (hosts) you need to monitor, with perpetual licences available. A fully functional 60-day free trial is also offered.
- Limitations: The primary drawback is its complexity. While powerful, getting the most out of Nagios XI requires a significant time investment in configuration and maintenance. The interface, though functional, lacks the polished feel of some newer competitors.
Website: https://www.nagios.com/products/nagios-xi/
7. SolarWinds Server & Application Monitor
SolarWinds Server & Application Monitor (SAM) is a robust tool designed for deep-dive diagnostics and performance management across both physical and virtual environments. It provides comprehensive monitoring for servers and over 1,200 applications and systems, allowing IT teams to pinpoint performance issues from the application layer down to the server hardware. What sets SAM apart in the crowded field of IT infrastructure monitoring tools is its powerful root cause analysis and infrastructure dependency mapping, which visualises how different components are interconnected.
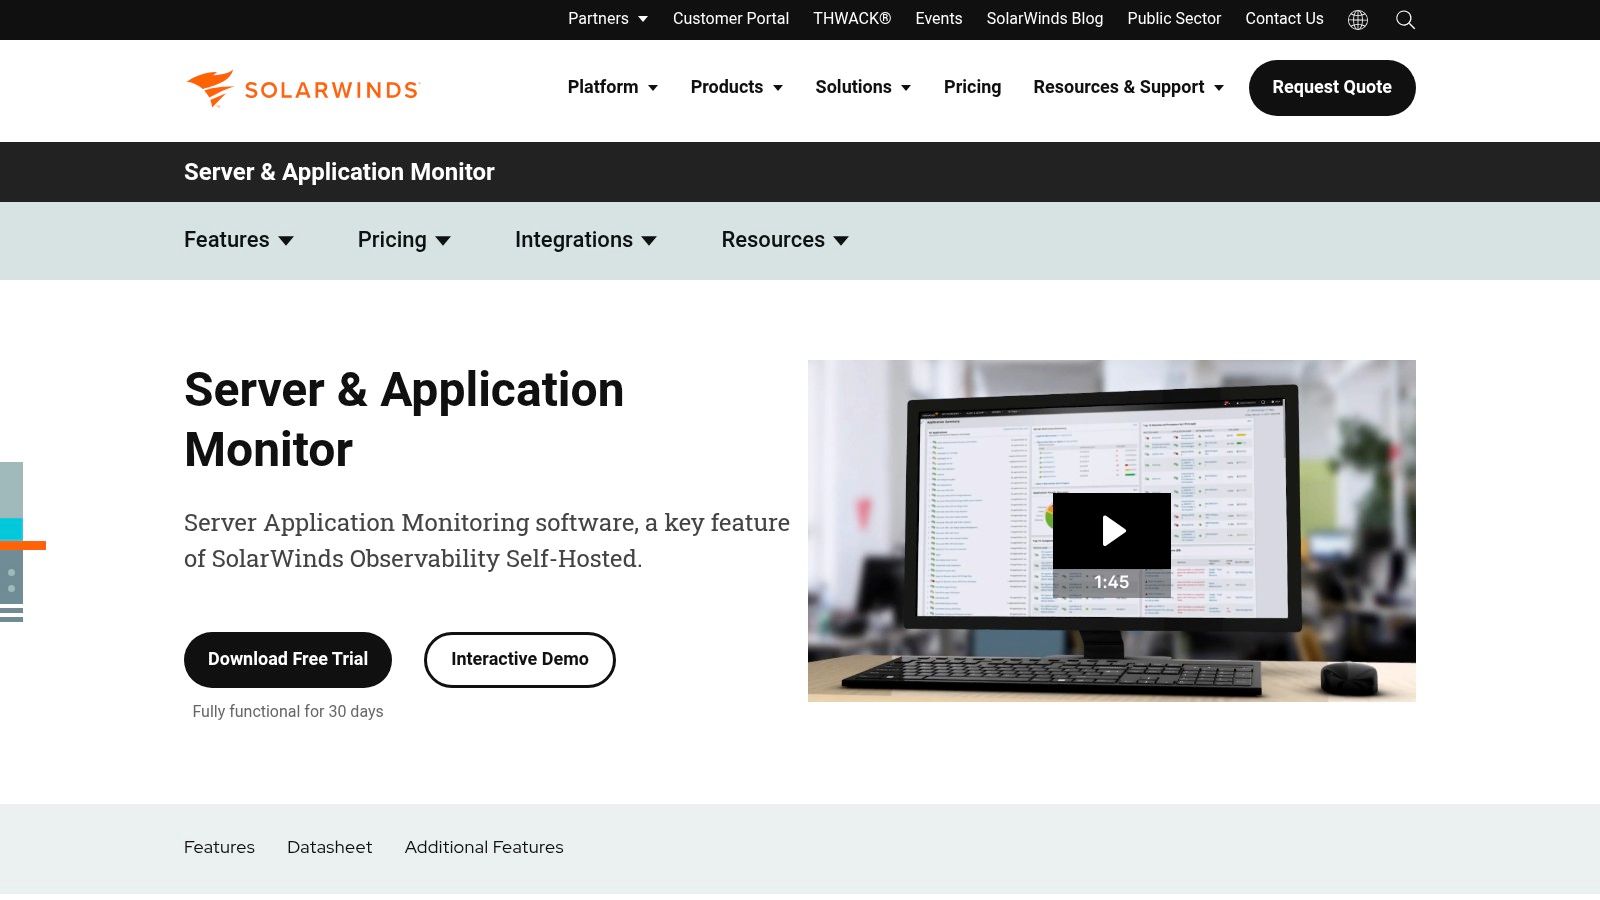
This capability helps teams quickly understand the ripple effects of a single component failure, significantly streamlining the troubleshooting process. The tool also excels in capacity planning, using historical performance data to forecast future resource needs, preventing outages before they happen. Its support for monitoring modern technologies like Docker containers ensures it remains relevant for organisations adopting containerisation. For those wanting a broader view, it's worth exploring how SolarWinds Server & Application Monitor compares to other tools.
Analysis & Key Considerations
- Best Use Case: Best suited for IT departments in small to large businesses that need detailed, agent-based monitoring of on-premises servers and critical business applications.
- User Experience: The interface is feature-rich and highly customisable. While this offers great power and flexibility, it may require some initial technical expertise to configure optimally.
- Pricing Structure: SolarWinds uses a perpetual licensing model based on the number of monitors (nodes, volumes, or application monitors). This can be cost-effective for stable environments but may be perceived as high for smaller organisations or those with fluctuating infrastructure needs. A fully functional 30-day free trial is available.
- Limitations: The primary drawback can be the initial setup complexity and the potential cost for smaller businesses. Its strength in on-premises monitoring means it may be less of a first choice for purely cloud-native environments.
Website: https://www.solarwinds.com/server-application-monitor
8. Splunk Infrastructure Monitoring
Splunk Infrastructure Monitoring, formerly SignalFx, is a real-time observability platform engineered for the complexities of modern, cloud-native environments. It provides high-cardinality streaming analytics and full-stack visibility, making it a powerful solution for organisations operating at scale. What sets Splunk apart is its no-sample, full-fidelity data ingestion, ensuring that every metric and trace is captured for precise analysis, especially in dynamic systems like Kubernetes and serverless functions.
This capability allows DevOps teams to move beyond basic health checks and perform sophisticated, real-time troubleshooting on live data streams combined with historical context. As one of the more advanced IT infrastructure monitoring tools, it automates the discovery and monitoring of microservices and containers. This enables teams to maintain comprehensive visibility even as their applications and infrastructure rapidly expand and evolve, a critical requirement for today’s agile development cycles.
Analysis & Key Considerations
- Best Use Case: Best suited for large enterprises and tech companies with extensive, dynamic cloud-native architectures, particularly those heavily invested in Kubernetes and microservices.
- User Experience: The interface is powerful and built for data scientists and senior engineers. While immensely capable, it can be complex for new users, requiring a significant investment in training to utilise its full potential.
- Pricing Structure: Splunk's pricing is typically usage-based and considered at the premium end of the market. The cost can be a significant factor for smaller organisations or those with unpredictable workloads, so careful planning is advised. A 14-day free trial is available.
- Limitations: The primary drawback is its high cost and complexity. The initial setup and configuration can be demanding, often requiring specialised expertise to integrate and manage effectively. Its deep feature set may be overkill for teams with simpler monitoring needs.
Website: https://www.splunk.com/en_us/products/infrastructure-monitoring.html
9. Checkmk
Checkmk stands out as a highly versatile and powerful IT infrastructure monitoring solution, renowned for its scalability and comprehensive coverage. It caters to a broad audience with both a feature-rich open-source edition and a robust enterprise version, making it adaptable for various organisational sizes and budgets. What truly sets Checkmk apart is its hybrid approach, combining high-performance agent-based monitoring with agentless methods to cover everything from servers, networks, and cloud services to containers and IoT sensors.
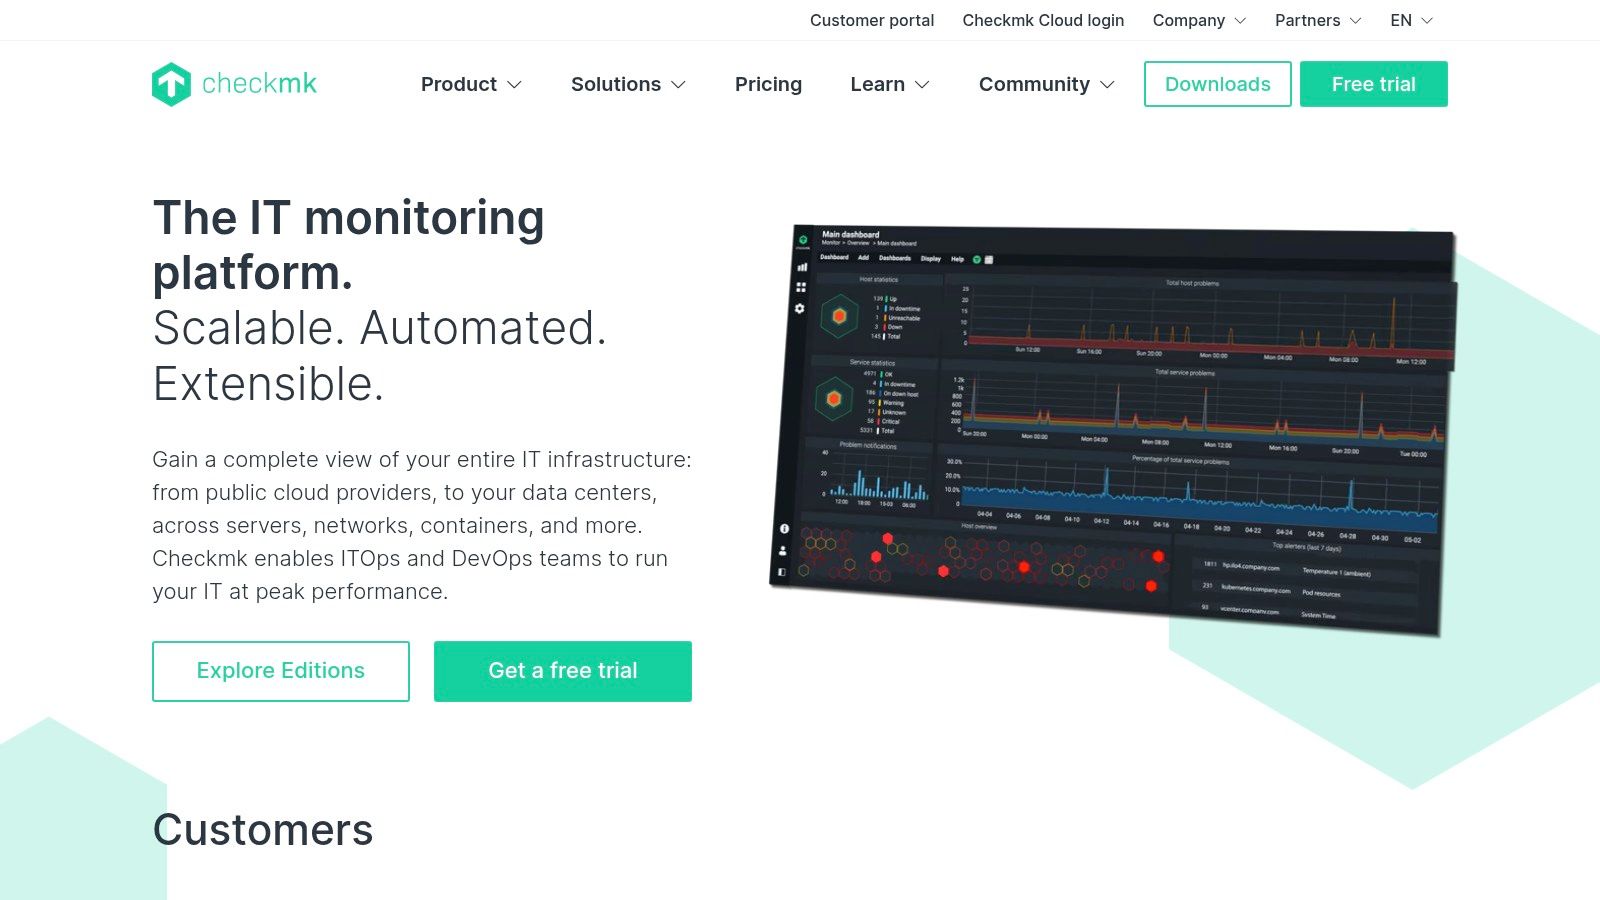
This flexibility allows it to monitor vast and complex environments with impressive efficiency. The platform utilises a unique auto-discovery engine that significantly simplifies configuration, automatically detecting services on a host and applying pre-configured monitoring rules. This automation makes it one of the more efficient IT infrastructure monitoring tools for large-scale deployments, drastically reducing the manual effort required to get started and maintain the system over time.
Analysis & Key Considerations
- Best Use Case: Suited for organisations of all sizes, from small businesses using the open-source version to large enterprises requiring scalable, all-encompassing monitoring for complex hybrid IT landscapes.
- User Experience: While powerful, the initial setup can be complex for newcomers. The user interface, though highly functional and data-rich, may feel less modern compared to some SaaS-first competitors, but it excels in delivering deep technical insights.
- Pricing Structure: The Checkmk Raw Edition is free and open-source. The Enterprise Edition is priced per monitored host, with various tiers available. A free 30-day trial of the Enterprise Edition is offered.
- Limitations: The primary challenge is the learning curve associated with its initial configuration and advanced features. The UI, while effective for technical users, might not appeal to those seeking a more visually polished, modern aesthetic.
Website: https://checkmk.com/
10. Icinga
Icinga is a powerful, open-source monitoring system that has evolved significantly from its Nagios-fork origins to become a highly flexible and scalable solution. It excels at checking the availability of network resources, notifying users of outages, and generating performance data for reporting. What sets Icinga apart among other IT infrastructure monitoring tools is its fundamentally modular architecture, allowing teams to build a monitoring stack that perfectly fits their specific requirements, from a simple server check to a complex, distributed environment.
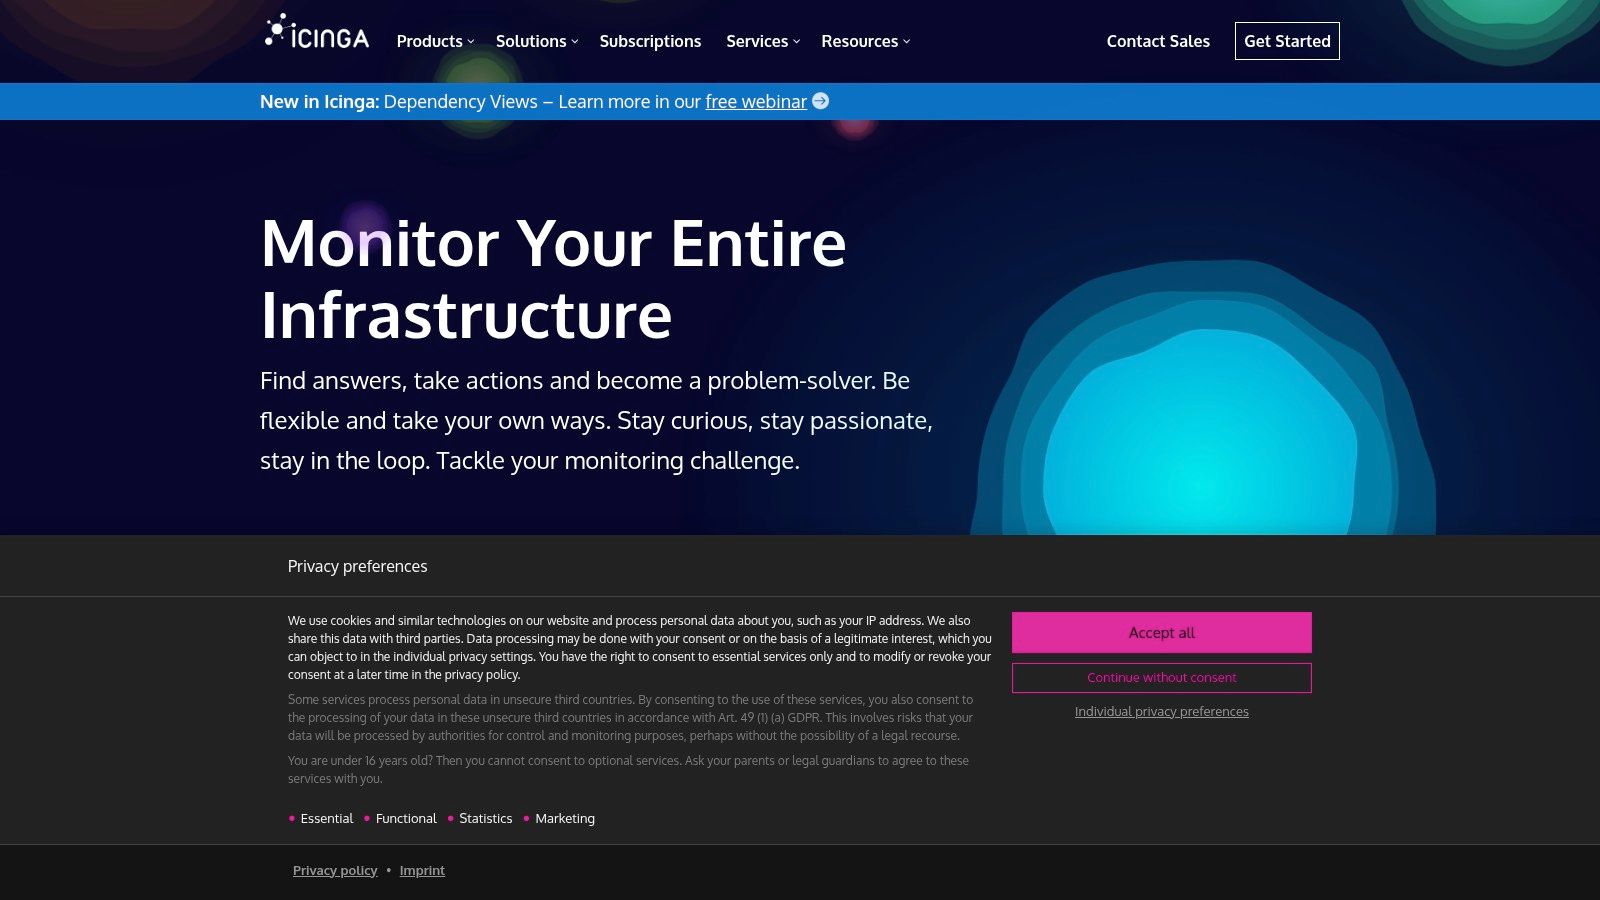
This modularity, combined with an extensive library of community-driven plugins, means you can monitor practically anything. Whether tracking standard services like HTTP and SMTP or custom in-house applications, Icinga's extensibility is its greatest strength. Its strong community backing ensures continuous development and a wealth of shared knowledge, making it a robust, no-cost alternative for organisations with the technical expertise to manage it.
Analysis & Key Considerations
- Best Use Case: Ideal for organisations of any size, from startups to large enterprises, that value customisation and control over their monitoring setup and have the in-house technical skills for an open-source tool.
- User Experience: The web interface (Icinga Web 2) is clean and functional but can feel less modern than its commercial counterparts. The initial setup and configuration can be complex, often requiring significant command-line work and configuration file editing.
- Pricing Structure: Icinga is completely free and open-source. Costs are associated with the hardware required to run it and the personnel time needed for setup, configuration, and ongoing maintenance.
- Limitations: The primary drawback is the steep learning curve and the complexity of its initial setup. Teams without a strong Linux/Unix background may find it challenging to deploy and maintain effectively compared to SaaS solutions.
Website: https://icinga.com/
11. OpenNMS
OpenNMS stands out as an enterprise-grade, open-source network monitoring and management platform. It is a powerful choice for organisations seeking deep control over their monitoring without the vendor lock-in of proprietary solutions. What truly distinguishes OpenNMS from other IT infrastructure monitoring tools is its robust, event-driven architecture designed for extreme scalability, capable of managing hundreds of thousands of devices from a single server.
The platform offers comprehensive service polling, data collection, and a flexible event and notification system. Backed by a vibrant community and offering professional support through The OpenNMS Group, it provides a cost-effective yet powerful alternative for sophisticated network management, making it ideal for IT departments that value customisation and have the technical expertise to leverage its full potential.
Analysis & Key Considerations
- Best Use Case: A great fit for organisations with large, complex network infrastructures and in-house technical teams who prefer an open-source, highly customisable solution.
- User Experience: The user interface, while highly functional, can feel dated compared to more modern, SaaS-based tools. The initial setup and configuration process can be complex and may present a steep learning curve for those unfamiliar with its architecture.
- Pricing Structure: OpenNMS is completely free and open-source. Optional commercial support, training, and consulting services are available through The OpenNMS Group, providing enterprise-level assurance.
- Limitations: Its primary drawbacks are the complexity of initial deployment and a less polished user interface. It requires significant technical knowledge to configure and maintain effectively, making it less suitable for smaller teams without dedicated IT staff.
Website: https://www.opennms.org/
12. Netdata
Netdata distinguishes itself in the crowded market of IT infrastructure monitoring tools with its focus on high-fidelity, real-time performance monitoring. It excels at collecting thousands of metrics per second from systems, hardware, and applications, presenting them in live, interactive, and easily understandable charts. This tool is designed to be incredibly lightweight and efficient, making it a perfect solution for troubleshooting and performance analysis directly on the system without significant overhead.
Its strength lies in its zero-configuration, auto-discovery capability, which immediately starts collecting and visualising data upon installation. For DevOps engineers and system administrators who need instant, granular insight into what is happening right now on a specific server or container, Netdata offers unparalleled immediacy. The strong community support and extensive documentation also make it an accessible choice for teams of all sizes.
Analysis & Key Considerations
- Best Use Case: Ideal for real-time, per-node troubleshooting and performance monitoring. It's a great fit for developers, system administrators, and smaller teams needing granular, second-by-second visibility into individual systems.
- User Experience: The user interface is highly intuitive, with auto-generated dashboards that are instantly useful. The live charts are visually engaging and make it simple to spot anomalies as they happen.
- Pricing Structure: Netdata is open-source and free for local, on-premise installations. The Netdata Cloud platform offers a free-forever plan for unlimited nodes and users, with paid tiers for extended data retention and more advanced features.
- Limitations: Its primary focus on real-time data means its default long-term historical data storage is limited. For comprehensive, long-term analysis across a large infrastructure, it often needs to be integrated with a dedicated time-series database like Prometheus or TimescaleDB.
Website: https://www.netdata.cloud/
Top 12 IT Infrastructure Monitoring Tools Comparison
| Solution | Core Features/Focus | User Experience ★ | Value Proposition 💰 | Target Audience 👥 | Unique Selling Points ✨ |
|---|---|---|---|---|---|
| Cloud Security Monitoring | Real-time threat detection, compliance, config | ★★★★☆ | 💰💰 Moderate – expert-tailored | Businesses needing cloud security | 🏆 AWS Well-Architected Framework, continuous compliance |
| Datadog | Unified monitoring, 500+ integrations | ★★★★☆ | 💰💰💰 Can be costly at scale | DevOps, hybrid-cloud teams | ✨ Intelligent alerting, extensive integrations |
| Zabbix | Open-source, network & cloud monitoring | ★★★☆☆ | 💰 Free, enterprise-ready | Enterprises, budget conscious | 🏆 Unlimited scalability, strong community support |
| Site24x7 | All-in-one monitoring, automated device mapping | ★★★★☆ | 💰 Flexible pricing w/ add-ons | IT professionals, SMBs | ✨ Automated discovery, free IT tools |
| PRTG Network Monitor | Sensor-based, customizable, high availability | ★★★★☆ | 💰💰 Pricey for large setups | Network admins, large infra | 🏆 300+ sensors, cluster failover |
| Nagios XI | Comprehensive IT infrastructure monitoring | ★★★☆☆ | 💰💰 Moderate to high | Enterprises, large environments | ✨ Vast plugin ecosystem, scalable |
| SolarWinds Server & App Monitor | Server/app monitoring, root cause analysis | ★★★★☆ | 💰💰💰 High for smaller orgs | IT ops, infrastructure teams | ✨ Docker container support, capacity planning |
| Splunk Infrastructure Monitoring | Real-time analytics, Kubernetes monitoring | ★★★★☆ | 💰💰💰 Premium pricing | Cloud native, Kubernetes users | 🏆 Auto Kubernetes monitoring, combined real-time/historical data |
| Checkmk | Multi-component monitoring, open-source/enterprise | ★★★☆☆ | 💰 Free/open-source & enterprise | Large-scale IT infra managers | 🏆 Scalable, versatile editions |
| Icinga | Network resource monitoring, modular architecture | ★★★☆☆ | 💰 Free/open-source | Network admins, open-source fans | ✨ Modular, highly extensible |
| OpenNMS | Network management, scalable, open-source | ★★★☆☆ | 💰 Free/open-source | Enterprises, network engineers | 🏆 Scalable & customizable with active community |
| Netdata | Real-time system metrics, lightweight | ★★★★☆ | 💰 Free, lightweight tool | Sysadmins, developers | ✨ Live interactive charts, efficient performance |
Building a Resilient Infrastructure with the Right Monitoring Partner
Navigating the expansive landscape of IT infrastructure monitoring tools is more than a simple procurement exercise; it is a fundamental strategic decision that directly shapes your organisation’s operational resilience, efficiency, and capacity for innovation. As we have explored throughout this guide, the market offers a diverse spectrum of solutions, each with distinct strengths tailored to different environments, team skills, and business goals. Your journey began with an understanding that modern monitoring transcends basic uptime checks; it’s about transforming raw data into the actionable intelligence your teams need to pre-empt issues, optimise performance, and secure your digital assets.
From the all-encompassing, SaaS-based observability of platforms like Datadog and Splunk to the powerful, self-hosted flexibility of open-source titans like Zabbix and Nagios XI, the core objective remains consistent: to achieve complete, granular visibility across every layer of your technology stack. The "right" tool is rarely a one-size-fits-all answer. It's the one that aligns seamlessly with your specific reality.
Synthesising Your Selection Criteria
The detailed analysis of tools ranging from Site24x7 to Checkmk highlights a critical takeaway: your choice must be a bespoke fit. Before committing to a platform, it is crucial to revisit your core requirements.
- Scale and Complexity: Is your infrastructure a straightforward setup of a few servers, or a sprawling, hybrid-cloud ecosystem with microservices and containerised applications? A tool like PRTG might be perfect for a mid-sized, on-premises network, whereas a globally distributed architecture would benefit more from the scalability of SolarWinds or the cloud-native approach of Splunk Infrastructure Monitoring.
- Team Expertise: Do you have a dedicated DevOps team comfortable with custom scripting and configuring open-source solutions like Icinga or OpenNMS? Or does your team need an intuitive, out-of-the-box solution with minimal setup overhead, like Site24x7, that allows them to focus on analysis rather than administration?
- Budgetary Realities: The total cost of ownership extends beyond subscription fees. Consider the implementation time, training requirements, and ongoing maintenance associated with open-source tools versus the predictable, albeit potentially higher, licensing costs of commercial products.
- Integration and Future-Proofing: Your chosen tool must integrate smoothly with your existing CI/CD pipelines, alerting systems (like PagerDuty or Slack), and ticketing platforms. Ensure the platform has a robust API and a strong community or vendor support system to accommodate future technological shifts.
From Selection to Strategic Implementation
Once you have selected a tool, implementation becomes the next critical phase. A poorly configured monitoring platform, regardless of its power, will only generate noise, not signals. Success hinges on a thoughtful rollout. Begin by defining what "normal" looks like for your key applications and infrastructure components by establishing performance baselines.
Prioritise what you monitor. Don’t fall into the trap of tracking every single metric available. Instead, focus on the key performance indicators (KPIs) and service level objectives (SLOs) that directly impact user experience and business outcomes. Refine your alerting thresholds continuously to minimise alert fatigue, ensuring that when an alert is triggered, it represents a genuine, actionable issue. Remember, a well-implemented monitoring strategy is not a "set and forget" project; it's an evolving practice that adapts alongside your infrastructure.
Ultimately, the goal of adopting any of these powerful IT infrastructure monitoring tools is to build a foundation of confidence. It's the confidence to deploy new code, scale services, and assure stakeholders that your systems are not just running, but are robust, secure, and performing optimally. This strategic visibility empowers you to move from a reactive, fire-fighting posture to a proactive, data-driven approach, fostering a culture of reliability that is essential for sustained business growth in today’s digital-first world.
Ready to move beyond tool selection and architect a world-class monitoring and security framework for your cloud environment? Signiance Technologies specialises in providing expert-led Cloud Security Monitoring services, helping you implement and manage the ideal solutions to gain deep visibility and protect your critical infrastructure. Contact Signiance Technologies today to ensure your cloud is not only monitored but truly resilient and secure.