Supercharge Your DevOps Performance
DevOps KPIs provide crucial insights into the effectiveness of your software development and deployment processes. So, what are the Top DevOps KPIs to Boost Your Performance in 2025!. This listicle identifies seven essential DevOps KPIs your team should track in 2025 to boost performance and demonstrate the ROI of your DevOps initiatives. Learn how to measure Deployment Frequency, Lead Time for Changes, Mean Time to Recovery (MTTR), Change Failure Rate, Automated Test Coverage, Application Performance, and Infrastructure as Code Coverage. These DevOps KPIs help optimize efficiency, speed, and stability across your development lifecycle.
1. Deployment Frequency
Deployment Frequency, a crucial DevOps KPI, measures how often an organization successfully releases software to production. This metric provides valuable insights into the efficiency and maturity of an organization’s software delivery lifecycle. It reflects the ability to deliver small batches of work quickly and reliably, a cornerstone of successful DevOps practices. High-performing DevOps teams deploy multiple times per day, demonstrating a streamlined and automated process. In contrast, lower-performing teams might deploy monthly or even quarterly, often indicating bottlenecks and inefficiencies in their workflows.
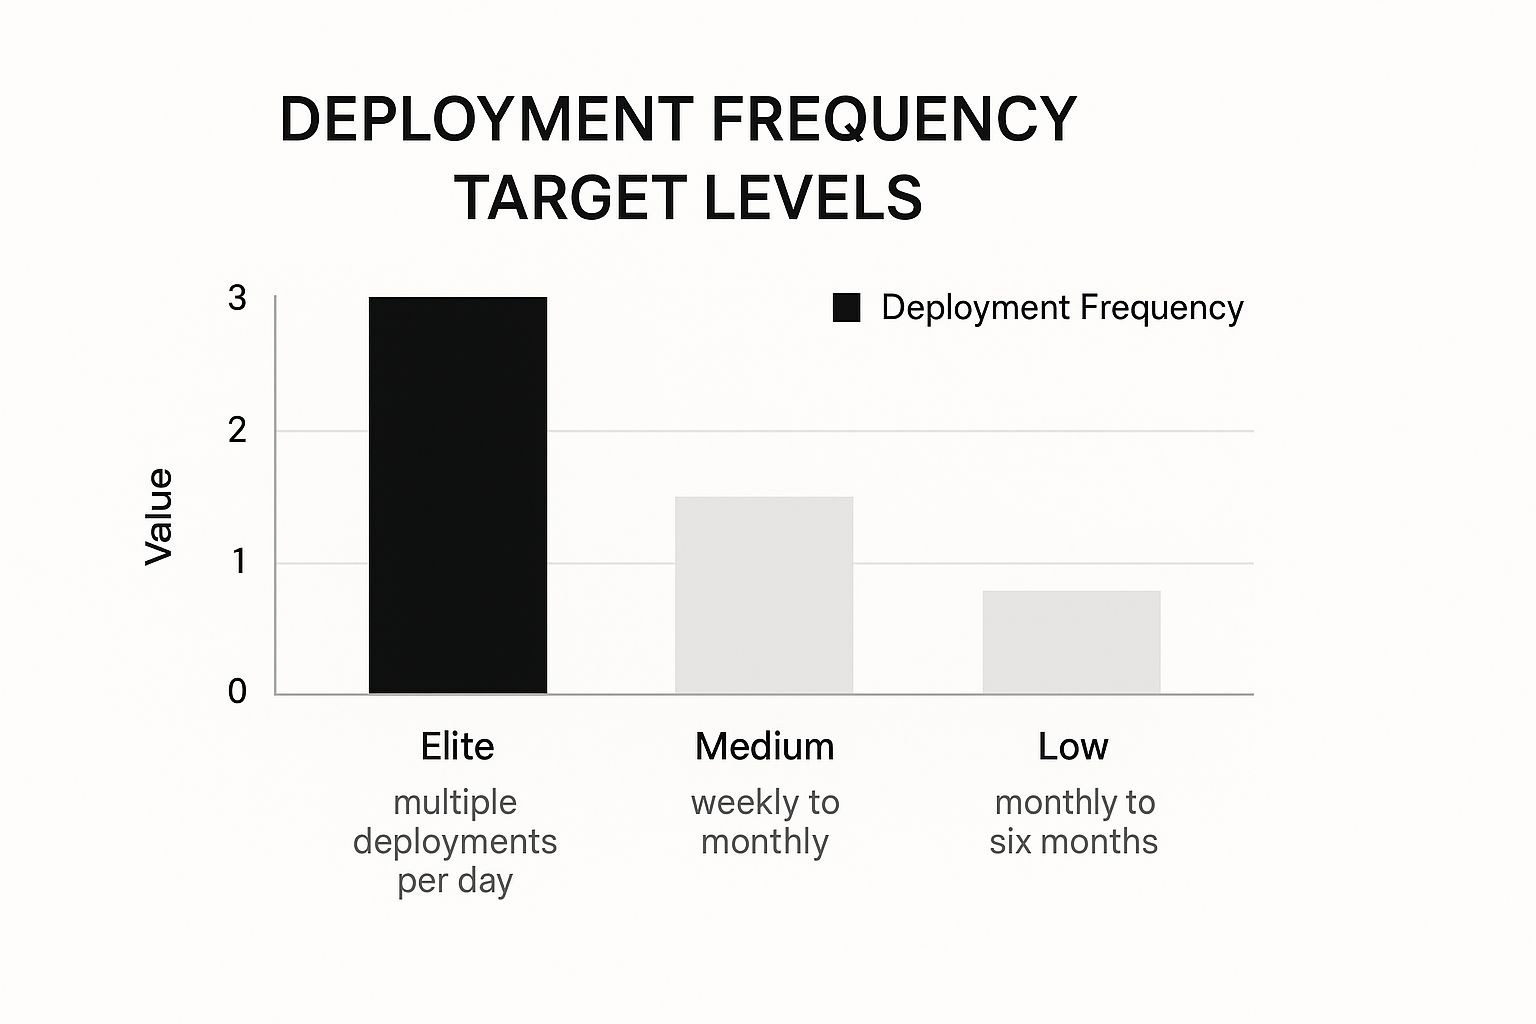
The infographic above visualizes the correlation between deployment frequency and lead time for changes, highlighting how more frequent deployments generally correlate with shorter lead times. It shows four quadrants representing low, medium, high, and elite performers, demonstrating how deployment frequency is a key differentiating factor between them. As the chart clearly shows, elite performers deploy multiple times per day and have significantly faster lead times for changes compared to low performers who deploy infrequently. This reinforces the idea that higher deployment frequency is indicative of a more mature and efficient DevOps practice.
This DevOps KPI deserves a prominent place in any performance evaluation because it directly correlates with business agility and responsiveness to market demands. Features of deployment frequency as a KPI include its ability to quantify the pace of software delivery, serving as a proxy for batch size (smaller, more frequent deployments are generally preferred), and directly correlating with DevOps maturity levels. It can be measured as deployments per day, week, or month, providing flexibility in tracking and reporting.
Why is this important for you in the IN region? The Indian tech landscape is booming, with intense competition among startups and established enterprises. Improving Deployment Frequency can give your organization a competitive edge by enabling faster delivery of new features and bug fixes, thereby enhancing customer satisfaction and time-to-market.
Examples of Successful Implementation:
- Amazon: Reportedly deploys code every 11.7 seconds on average, showcasing an extremely mature and automated deployment process.
- Google: Performs thousands of deployments daily across its services, demonstrating the scalability of frequent deployment practices.
- Netflix: Has built a robust deployment platform enabling multiple daily deployments, contributing to its ability to continuously innovate and improve its streaming service.
Pros:
- Encourages continuous delivery practices.
- Reduces deployment risk through smaller change batches.
- Provides direct feedback on process improvements.
- Easy to measure objectively.
Cons:
- Can create pressure to deploy for the sake of metrics rather than value.
- May not be appropriate to maximize in all contexts (e.g., firmware).
- Doesn’t measure deployment quality or value.
Actionable Tips:
- Start by establishing a baseline measurement of your current deployment frequency. This will provide a starting point for tracking progress and identifying areas for improvement.
- Implement CI/CD pipelines to automate the deployment process. Automation is crucial for achieving high deployment frequency and reducing manual errors.
- Break down large releases into smaller, more manageable chunks. This reduces risk and makes it easier to identify and fix issues quickly.
- Celebrate improvements in deployment frequency as team wins. Recognizing and rewarding progress helps to foster a culture of continuous improvement.
Deployment Frequency is popularized by the DORA (DevOps Research and Assessment) team at Google, Jez Humble and Nicole Forsgren in the ‘Accelerate’ book, and the State of DevOps Report. By focusing on this key DevOps KPI, organizations in the IN region can significantly improve their software delivery performance, achieve greater agility, and gain a competitive edge in the market.
2. Lead Time for Changes
Lead Time for Changes is a crucial DevOps KPI that measures the time elapsed between committing code and deploying it to production. This metric provides valuable insights into the efficiency and speed of your entire software delivery pipeline. For organizations in IN striving to enhance their DevOps practices, understanding and optimizing Lead Time for Changes is paramount to achieving faster release cycles and improved business agility.
How it Works:
The clock starts ticking the moment a developer commits code to the version control system. It stops when that code is successfully running in the production environment, accessible to end-users. This encompasses the entire process, including building, testing, deploying, and releasing. A shorter lead time indicates a streamlined, automated pipeline, while a longer lead time suggests potential bottlenecks and areas for improvement.
Why is it Important (and Deserves its Place on the List)?
In today’s fast-paced digital landscape, speed is a competitive advantage. Lead Time for Changes directly reflects how quickly your organization can respond to market demands, customer feedback, and emerging opportunities. It’s a key indicator of your DevOps maturity and ability to deliver value rapidly. By tracking and optimizing this KPI, organizations can significantly improve their agility, reduce time to market, and gain a competitive edge. This is particularly relevant for startups and enterprise IT departments in IN aiming to scale rapidly and efficiently.
Features and Benefits:
- Measures Speed and Efficiency: Provides a quantifiable measure of the development pipeline’s performance.
- End-to-End Visibility: Offers a holistic view of the entire software delivery process, from code commit to production deployment.
- Automation Indicator: Reflects the level of automation implemented in the pipeline. Higher automation typically leads to shorter lead times.
- Agility Correlation: A strong indicator of organizational agility and the ability to adapt to change quickly.
- Identifies Bottlenecks: Pinpoints specific stages in the pipeline that are causing delays, enabling targeted improvements.
- Supports Continuous Improvement: Provides a concrete metric to track progress and demonstrate the impact of DevOps initiatives.
Pros:
- Insight into overall development process efficiency.
- Identifies bottlenecks in the development pipeline.
- Gives a concrete metric for continuous improvement.
- Correlates with business responsiveness.
Cons:
- Can be affected by factors outside developer control (e.g., approval processes).
- May not account for intentional delays (e.g., coordinated releases).
- Requires consistent definition and measurement across teams.
Examples of Successful Implementation:
- Etsy: Reduced lead time from days to under 30 minutes.
- Nordstrom: Decreased lead time from 3 months to 1 week.
- Capital One: Improved lead time by 85% through automated testing and deployment.
Actionable Tips for Improvement:
- Segment and Analyze: Break the lead time into smaller segments (e.g., build time, testing time, deployment time) to isolate bottlenecks.
- Automate Aggressively: Focus on automating manual steps in the deployment pipeline, such as testing, deployments, and infrastructure provisioning.
- Feature Flags: Decouple deployment from feature release using feature flags, allowing for faster deployments and controlled rollouts.
- Streamline Approvals: Reduce unnecessary approval steps and bureaucracy where safe to do so, enabling faster flow.
- Embrace Continuous Integration: Cultivate a continuous integration mindset, encouraging frequent code commits and automated builds.
Popularized By:
- DORA metrics framework
- Gene Kim in ‘The Phoenix Project’
- Nicole Forsgren in ‘Accelerate’
By focusing on Lead Time for Changes, organizations in IN – from startups to large enterprises – can accelerate their software delivery, improve responsiveness to market demands, and drive business growth. This makes it an essential KPI for any DevOps team.
3. Mean Time to Recovery (MTTR)
Mean Time to Recovery (MTTR) is a crucial DevOps KPI that measures the average time it takes to restore service after a production failure or incident. This metric encompasses the entire process, from the moment an incident is detected to the point where full functionality is restored. For businesses in the IN region and globally, minimizing MTTR is paramount for maintaining customer satisfaction, preserving revenue streams, and upholding a strong brand reputation. MTTR’s importance earns it a prominent place in any list of essential DevOps KPIs. It’s a direct reflection of your operational resilience and the effectiveness of your incident response processes.
How MTTR Works and Why It Matters
MTTR isn’t just about fixing problems quickly; it’s about optimizing the entire incident lifecycle. This includes how fast your team detects an issue, how efficiently they diagnose the root cause, and how swiftly they implement a solution. A lower MTTR demonstrates a mature DevOps practice, capable of minimizing the impact of failures on users. This is particularly vital in today’s always-on digital landscape, where downtime can translate to significant financial losses and reputational damage.
For startups and early-stage companies, a low MTTR can be a competitive advantage, demonstrating reliability and building trust with early adopters. For enterprise IT departments, it’s essential for maintaining service level agreements (SLAs) and minimizing business disruption. Cloud architects and developers can leverage MTTR data to identify weaknesses in system design and prioritize resilience. DevOps and infrastructure teams directly benefit from optimized MTTR as it streamlines their workflows and reduces firefighting. Finally, business decision-makers and CTOs can use MTTR as a key performance indicator to track the effectiveness of their technology investments.
Features and Benefits:
- Measures Incident Recovery Efficiency: Provides a quantifiable measure of how quickly your team responds to and resolves incidents.
- Encompasses Detection, Response, and Resolution Time: Covers the entire incident lifecycle, not just the fix itself.
- Indicates Operational Resilience: Reflects the ability of your systems and teams to withstand and recover from failures.
- Reflects Effectiveness of Monitoring, Alerting, and Incident Response: Highlights the strengths and weaknesses of your monitoring and response infrastructure.
Pros:
- Focuses Teams on Building Resilient Systems: Encourages proactive measures to prevent and mitigate future incidents.
- Encourages Investment in Monitoring and Observability: Highlights the value of comprehensive monitoring and alerting tools.
- Promotes Blameless Postmortems and Learning Culture: Fosters a culture of continuous improvement and learning from failures.
- More Important Than Preventing All Failures (Which Is Impossible): Acknowledges that failures are inevitable and focuses on minimizing their impact.
Cons:
- Can Be Skewed by Outlier Incidents: A single, exceptionally long incident can disproportionately affect the average.
- Difficult to Standardize What Constitutes an ‘Incident’: Requires clear definitions and consistent reporting practices.
- May Encourage Quick Fixes Over Proper Resolution: Teams might prioritize speed over addressing the root cause to improve MTTR.
- Doesn’t Account for Incident Severity Differences: A minor incident and a major outage can have the same MTTR, masking the true impact.
Examples of Successful Implementation:
- Google SRE teams rigorously track and optimize MTTR across their services, setting industry benchmarks for reliability.
- Microsoft Azure publishes MTTR as part of their SLA commitments, demonstrating their commitment to service availability.
- GitHub reduced MTTR by 90% by implementing automated rollbacks, showcasing the power of automation in incident response.
Actionable Tips for Improving MTTR:
- Implement Robust Monitoring and Alerting Systems: Invest in tools that provide real-time visibility into your systems and trigger alerts for potential issues.
- Create Runbooks for Common Failure Scenarios: Document standardized procedures for resolving common incidents to expedite response times.
- Practice Chaos Engineering to Improve Recovery Processes: Simulate failures in a controlled environment to identify weaknesses and improve resilience.
- Use Feature Flags to Disable Problematic Features Quickly: Isolate and disable faulty features without requiring a full deployment rollback.
- Conduct Regular Incident Response Drills: Practice your incident response procedures to ensure teams are prepared for real-world scenarios.
- Document and Analyze Each Incident to Prevent Recurrence: Conduct thorough postmortems to identify root causes and implement preventative measures.
Popularized By:
- DORA research group
- Google SRE (Site Reliability Engineering) practices
- PagerDuty’s reliability methodologies
4. Change Failure Rate
Change Failure Rate is a crucial DevOps KPI that measures the percentage of deployments resulting in degraded service or requiring remediation such as hotfixes, rollbacks, or patches. This metric provides valuable insights into the stability and quality of your software delivery process. A lower change failure rate generally indicates that your testing, quality assurance (QA), and deployment processes are effective at identifying and addressing issues before they impact users in a production environment. This KPI is especially relevant for DevOps teams aiming to balance speed and stability in their release cycles. Tracking and optimizing Change Failure Rate helps organizations improve their software delivery performance, reduce the risk of production incidents, and build a more reliable system for their users.

This metric is calculated as: *(Number of failed deployments / Total number of deployments) * 100%. It reflects the effectiveness of your testing, QA, and deployment pipelines, and signifies the balance your team maintains between rapid iteration and stable deployments. For example, a Change Failure Rate of 20% means that 20 out of every 100 deployments experience problems requiring intervention.
Why Change Failure Rate Deserves its Place in Your DevOps KPIs:
In the fast-paced world of software development, particularly for startups and enterprise IT departments striving for continuous delivery, minimizing disruptions is paramount. Change Failure Rate offers a direct line of sight into the health of your release pipeline, providing actionable data to identify weaknesses and improve processes. It allows cloud architects, developers, DevOps, and infrastructure teams to quantify the impact of changes and directly correlate them with service stability. This data empowers business decision-makers and CTOs to make informed decisions about resource allocation and risk management.
Features and Benefits:
- Direct Feedback Loop: Offers immediate feedback on the efficacy of your code quality and testing strategies.
- Balancing Speed and Stability: Facilitates finding the optimal balance between rapid deployments and maintaining a reliable service.
- Technical Debt Indicator: Highlights potential technical debt accumulation that might be impacting deployment success rates.
- Incentivizes Improvement: Encourages teams to prioritize thorough testing and validation practices.
Pros:
- Provides direct feedback on code quality and testing effectiveness.
- Helps balance deployment speed with reliability.
- Identifies when teams are taking on too much technical debt.
- Creates incentives for better testing and validation.
Cons:
- May discourage innovation if teams become too risk-averse.
- Can be manipulated by redefining what constitutes a ‘failure’.
- Doesn’t distinguish between major and minor failures.
- Might lead to blame if not used in a supportive culture.
Examples of Successful Implementation:
- Google maintains a change failure rate below 15% while deploying thousands of times daily.
- Target reduced their change failure rate from 42% to 8% after implementing automated testing.
- Spotify uses this metric to maintain reliability while promoting engineering autonomy.
Actionable Tips for Improvement:
- Implement robust automated testing: Incorporate unit, integration, and end-to-end tests in your CI/CD pipeline.
- Utilize feature flags: Decouple deployment from feature release, allowing for controlled rollouts and easier rollback.
- Conduct pre-deployment risk assessments: Identify potential risks associated with changes before they reach production.
- Adopt advanced deployment strategies: Implement blue/green or canary deployments to minimize the impact of failed deployments.
- Establish clear failure criteria: Define what constitutes a “failed” deployment to ensure consistent measurement and reporting.
- Foster a learning culture: Focus on learning from failures rather than assigning blame.
Popularized By:
- DORA metrics framework
- The State of DevOps Reports
- Jez Humble and Nicole Forsgren’s research
By incorporating Change Failure Rate as a key DevOps KPI, organizations in the IN region and globally can gain valuable insights into their software delivery performance and work towards achieving a more reliable and efficient deployment process.
5. Automated Test Coverage
Automated Test Coverage is a crucial DevOps KPI that measures the percentage of an application’s codebase exercised by automated tests. This metric provides valuable insight into the effectiveness of your testing strategy and the overall health of your code, directly impacting your ability to deliver high-quality software quickly and reliably. This makes it an essential consideration for everyone from startups to enterprise IT departments, cloud architects, developers, DevOps teams, and even business decision-makers. In the fast-paced world of DevOps, understanding and optimizing test coverage is key to achieving efficient and stable deployments.
How it Works:
Automated test coverage analyzes your codebase and identifies which parts are executed during the running of your automated test suites. These tests, which can range from unit tests targeting individual components to end-to-end tests evaluating the entire application flow, effectively “cover” a certain portion of your code. The coverage is typically expressed as a percentage, representing the proportion of code that has been tested. Different types of coverage analysis provide varied levels of detail:
- Statement Coverage: Measures the percentage of lines of code executed during testing.
- Branch Coverage: Measures the percentage of code branches (e.g., if-else conditions) executed.
- Path Coverage: Measures the percentage of possible execution paths through the code that are tested. This is the most comprehensive but also the most complex to achieve.
Why It Deserves Its Place in the List of DevOps KPIs:
Automated test coverage is essential for modern DevOps practices because it fosters confidence in deployments. High test coverage reduces the risk of introducing regressions or bugs into production, supporting higher deployment frequency and lower change failure rates. This directly translates to faster time-to-market, reduced development costs, and increased customer satisfaction.
Features and Benefits:
- Quantifiable Measurement: Provides a concrete metric to track and improve testing effectiveness.
- Breakdown by Test Type: Allows you to analyze coverage across different test levels (unit, integration, end-to-end).
- Early Bug Detection: Helps identify and fix issues early in the development cycle.
- Improved Code Quality: Encourages better coding practices and more robust software design.
- Living Documentation: Serves as up-to-date documentation of the system’s intended behavior.
Pros:
- Increased confidence in code changes and refactoring
- Reduced regression bugs and associated costs
- Enables faster deployments through automated verification
- Creates living documentation of expected system behavior
Cons:
- High coverage doesn’t guarantee high-quality tests (tests can be written poorly even if they achieve high coverage).
- Can lead to a focus on achieving coverage targets rather than writing meaningful tests.
- May be challenging to achieve high coverage in legacy codebases.
- Different types of coverage provide different insights and should be interpreted carefully.
Examples of Successful Implementation:
- Google maintains over 80% test coverage across their core services.
- Netflix built Spinnaker, their continuous delivery platform, with a test-first approach achieving over 90% coverage.
- Atlassian requires minimum coverage thresholds before code can be merged.
Actionable Tips:
- Prioritize Critical Paths: Focus on testing the most critical parts of your application and core business logic first.
- Incremental Goals: Set achievable, incremental coverage goals. Don’t aim for 100% immediately.
- CI/CD Integration: Integrate coverage checks into your Continuous Integration/Continuous Delivery (CI/CD) pipelines to automate the process.
- Diverse Test Suite: Use a mix of unit, integration, and end-to-end tests for comprehensive coverage.
- Test-Driven Development (TDD): Write tests before writing the code whenever possible. This fosters a test-first mindset and leads to more testable code.
- Consider Code Complexity: Adjust your coverage goals based on the complexity of the code. More complex modules may require higher coverage.
Popularized By:
- Kent Beck, through Test-Driven Development (TDD)
- Martin Fowler, through his work on Continuous Integration
- Tools like SonarQube, Codecov, and JaCoCo
By focusing on automated test coverage as a key DevOps KPI, organizations in the IN region, from budding startups to established enterprises, can significantly improve their software development processes, deliver higher quality products, and achieve greater business agility.
6. Application Performance
Application Performance is a crucial DevOps KPI that measures how well an application responds to user requests. It provides insights into the end-user experience and the operational efficiency of the system, reflecting how quickly and reliably users can access and interact with the application. This is measured through key metrics such as response time (how long it takes for the application to respond to a request), throughput (the number of requests the application can handle in a given period), and error rates (the percentage of requests that result in errors). In a DevOps environment, focusing on application performance is critical because it directly represents the value delivered to users and subsequently impacts business outcomes. Slow or unreliable applications can lead to user frustration, lost revenue, and damage to brand reputation.

Application performance encompasses several key features: It measures the real user experience and provides valuable data on system efficiency. It allows granular analysis by breaking down performance metrics by service, specific endpoint, or even a complete user journey. Furthermore, it often utilizes Apdex scores, which provide a standardized measure of user satisfaction levels based on response time thresholds. This makes it a well-rounded KPI offering actionable insights.
Pros of Tracking Application Performance:
- Directly correlates with user satisfaction and business metrics: Improved application performance directly translates to happier users and positive business outcomes, like increased conversions and revenue.
- Provides early warning of potential issues: Monitoring application performance helps identify potential bottlenecks and performance degradation early on, allowing for proactive intervention before they impact users significantly.
- Helps identify optimization opportunities: Performance data can pinpoint areas for improvement within the application, infrastructure, or codebase, leading to more efficient resource utilization and better overall performance.
- Creates shared accountability between development and operations: By focusing on application performance as a shared KPI, development and operations teams are incentivized to collaborate and ensure optimal performance throughout the application lifecycle.
Cons of Tracking Application Performance:
- Can be affected by factors outside direct control: External factors like network conditions or third-party service outages can influence application performance, making it challenging to isolate internal issues.
- Requires careful definition of meaningful thresholds: Setting appropriate performance thresholds requires careful consideration of user expectations and business requirements. What constitutes “good” performance can vary depending on the application and its context.
- May need contextual interpretation: Performance data should be interpreted in context, considering factors like time of day, user location, and device type, to avoid drawing misleading conclusions.
- Can be complex to measure and attribute properly: Accurately measuring and attributing performance issues to specific components or services can be complex, requiring sophisticated monitoring and analysis tools.
Examples of Successful Implementation:
- Amazon: Found that every 100ms of latency cost them 1% in sales, highlighting the direct impact of performance on revenue.
- Google: Uses page load time as a key ranking factor for search results, recognizing the importance of performance for user experience.
- Walmart: Saw a 2% conversion increase for every 1 second of performance improvement, demonstrating the tangible benefits of optimizing application performance.
Tips for Implementing Application Performance Monitoring as a DevOps KPI:
- Establish clear performance baselines and objectives: Define what constitutes acceptable performance levels and set realistic goals for improvement.
- Implement Real User Monitoring (RUM) and Synthetic Monitoring: Use RUM to track real user experiences and synthetic monitoring to proactively identify potential issues in controlled environments.
- Set up automated performance testing in CI/CD pipelines: Integrate performance testing into the development lifecycle to catch performance regressions early.
- Create performance budgets for new features: Allocate performance budgets for new features to prevent them from negatively impacting overall application performance.
- Monitor both backend and frontend performance metrics: Gain a holistic view of performance by tracking metrics for both the backend infrastructure and the frontend user interface.
- Correlate performance metrics with business outcomes: Connect performance data to key business metrics to demonstrate the impact of performance improvements on the bottom line.
Popularized By: Google’s Core Web Vitals initiative, New Relic and Datadog monitoring platforms, and Steve Souders’ web performance optimization work have significantly contributed to the widespread adoption and understanding of application performance as a critical metric.
Application Performance deserves its place in the list of essential DevOps KPIs because it bridges the gap between technical operations and business outcomes. By focusing on this KPI, organizations in India, from startups to enterprise IT departments, can ensure they deliver high-quality user experiences that drive customer satisfaction and business success. It offers a concrete, measurable way to assess the effectiveness of DevOps practices and prioritize improvements that directly benefit users.
7. Infrastructure as Code Coverage
Infrastructure as Code (IaC) Coverage is a crucial DevOps KPI that measures the percentage of your infrastructure managed through code rather than manual processes. This includes everything from servers and networks to databases and cloud resources. Tracking and improving your IaC coverage is essential for achieving DevOps maturity and optimizing your infrastructure management, especially crucial for startups, enterprise IT departments, cloud architects, and DevOps teams in the IN region. This metric deserves its place on the list of essential DevOps KPIs because it directly reflects the level of automation and standardization within your infrastructure. By focusing on IaC Coverage, organizations can unlock significant benefits in terms of speed, consistency, and reliability.
How It Works:
IaC Coverage measures both the breadth (number of components managed by code) and depth (aspects of those components automated). Instead of manually configuring servers, networks, and other infrastructure elements, you define them in code using tools like Terraform, AWS CloudFormation, or Ansible. This code can then be versioned, tested, and deployed just like application code, enabling consistent and repeatable infrastructure provisioning.
Why Use IaC Coverage as a KPI?
This KPI provides valuable insights into your DevOps maturity. A higher IaC coverage indicates a greater level of automation, which translates into:
- Consistent Environments: Eliminate configuration drift and “snowflake servers” that behave unpredictably.
- Rapid Provisioning: Deploy infrastructure significantly faster than with manual processes.
- Improved Governance: Centralized code management provides better control and visibility over infrastructure changes.
- Enhanced Disaster Recovery: Recreate infrastructure quickly and reliably in case of failures.
- Stronger Security: Standardized and automated security practices can be embedded directly into your IaC.
Features and Benefits:
- Quantifies Automation: Provides a clear, measurable indicator of infrastructure automation progress.
- Comprehensive Scope: Encompasses various infrastructure components including servers, networks, databases, and cloud resources.
- Maturity Indicator: Reflects the level of sophistication in configuration management.
- Facilitates Collaboration: Provides a shared language and framework for developers and operations teams.
Pros:
- Enables consistent, repeatable environment creation.
- Reduces configuration drift and ‘snowflake’ servers.
- Facilitates disaster recovery and business continuity.
- Improves security through standardization and automated compliance.
Cons:
- Initial implementation requires significant investment.
- Legacy systems may be difficult to incorporate.
- Requires new skills and mindset from traditional ops teams.
- Can introduce ‘infrastructure as code’ anti-patterns if not properly managed.
Examples of Successful Implementation:
- Netflix manages nearly 100% of its AWS infrastructure through custom IaC tools.
- HashiCorp, creators of Terraform, reportedly achieved 95% IaC coverage.
- Capital One migrated to 80% IaC coverage during its cloud transformation, demonstrating its effectiveness even for large enterprises.
Actionable Tips:
- Start Small: Begin with new projects and gradually refactor existing infrastructure.
- Leverage Established Tools: Utilize popular tools like Terraform, AWS CloudFormation, or Ansible.
- Implement Infrastructure Testing: Test your infrastructure code just as rigorously as application code.
- Version Control: Store IaC in version control systems like Git.
- Modular Design: Build reusable infrastructure components to enhance efficiency.
- Security First: Integrate security and compliance requirements into your IaC templates from the outset.
Popularized By:
HashiCorp with Terraform, AWS CloudFormation, Martin Fowler’s writings on Continuous Delivery, and configuration management pioneers like Puppet and Chef have all played a significant role in popularizing IaC.
By incorporating IaC Coverage as a key DevOps KPI, organizations in the IN region, from startups to large enterprises, can streamline infrastructure management, improve agility, and enhance reliability, contributing significantly to their overall DevOps success.
7 DevOps KPI Comparison
| KPI | Implementation Complexity | Resource Requirements | Expected Outcomes | Ideal Use Cases | Key Advantages |
|---|---|---|---|---|---|
| Deployment Frequency | Moderate requires CI/CD pipelines and automation | Moderate CI/CD tools, pipeline maintenance | Faster release cycles and improved process feedback | High-velocity delivery teams, SaaS, cloud-native | Encourages continuous delivery , reduces risk |
| Lead Time for Changes | High – involves end-to-end pipeline optimization | High – automation, streamlined approvals | Shorter time from commit to production | Agile teams needing rapid business response | Reveals bottlenecks, increases business agility |
| Mean Time to Recovery (MTTR) | Moderate to high monitoring and incident tooling required | Moderate monitoring, alerting, runbooks | Faster recovery from failures | Systems requiring high reliability and uptime | Improves resilience, encourages learning culture |
| Change Failure Rate | Moderate testing frameworks and deployment strategies | Moderate to high automated testing, feature flagging | Lower percentage of failed deployments | High-quality sensitive environments | Improves reliability, balances speed and stability |
| Automated Test Coverage | High comprehensive test writing and maintenance | High test infrastructure, tooling, and developer time | Higher code confidence, fewer regressions | Complex codebases, critical applications | Enables safer refactoring , faster deployments |
| Application Performance | High requires monitoring and performance testing | High monitoring tools, real user and synthetic testing | Better user experience and business impact | Customer-facing apps, high-traffic systems | Increases user satisfaction, early issue detection |
| Infrastructure as Code Coverage | High infrastructure automation and versioning efforts | High – tooling (Terraform, Ansible), skill development | Consistent environments and rapid provisioning | Cloud migrations, large-scale infrastructure | Reduces drift , improves compliance and recovery |
Taking Your DevOps to the Next Level
This article has explored seven key DevOps KPIs Deployment Frequency, Lead Time for Changes, Mean Time to Recovery (MTTR), Change Failure Rate, Automated Test Coverage, Application Performance, and Infrastructure as Code Coverage that provide a holistic view of your software delivery lifecycle. By focusing on these DevOps KPIs, you gain valuable insights into your team’s performance, identify areas for improvement, and demonstrate the ROI of your DevOps initiatives. Mastering these metrics empowers your teams to make data-driven decisions, optimize processes, and ultimately deliver higher-quality software faster.
Optimizing your CI/CD pipeline is crucial for achieving top DevOps performance. For a comprehensive guide on implementing best practices, check out this resource: CI/CD pipeline best practices. These best practices will further enhance your ability to leverage DevOps KPIs for continuous improvement.
These KPIs are not merely numbers; they are a roadmap to achieving your business goals. Whether you’re a startup aiming for rapid growth or an enterprise seeking enhanced efficiency, tracking and iterating on these DevOps KPIs is crucial for success in today’s competitive landscape. Remember that DevOps is a continuous journey of learning and improvement. Embrace the data, empower your teams, and unlock the full potential of your software delivery process.
Ready to take your DevOps performance to the next level? Signiance Technologies specializes in helping businesses effectively leverage DevOps KPIs to drive growth and innovation. Visit Signiance Technologies today to learn how we can help you optimize your cloud infrastructure and DevOps processes.