The Complete Guide to Amazon Quick Suite and Its Revolutionary AI-Powered BI Transformation
The Evolution from QuickSight to Quick Suite
What Changed and Why
The transition from QuickSight to Quick Suite addresses a critical gap in enterprise analytics: the disconnect between data insights and actionable business outcomes. While traditional BI tools excel at visualization and reporting, organizations struggled to bridge the gap between “knowing” and “doing”.
Quick Suite introduces agentic AI capabilities that don’t just present data—they actively participate in business processes, automate workflows, and provide contextual intelligence. This evolution transforms QuickSight from a passive analytics tool into an active business companion.
Technical Architecture Overview
Quick Suite maintains the core SPICE (Super-fast Parallel In-memory Calculation Engine) architecture while adding four new foundational components:
- Quick Sight: Enhanced BI capabilities with AI-powered insights
- Quick Research: Enterprise knowledge synthesis with citations
- Quick Flows: Natural language workflow automation
- Quick Automate: Complex multi-step process orchestration
- Quick Index: Centralized knowledge management system
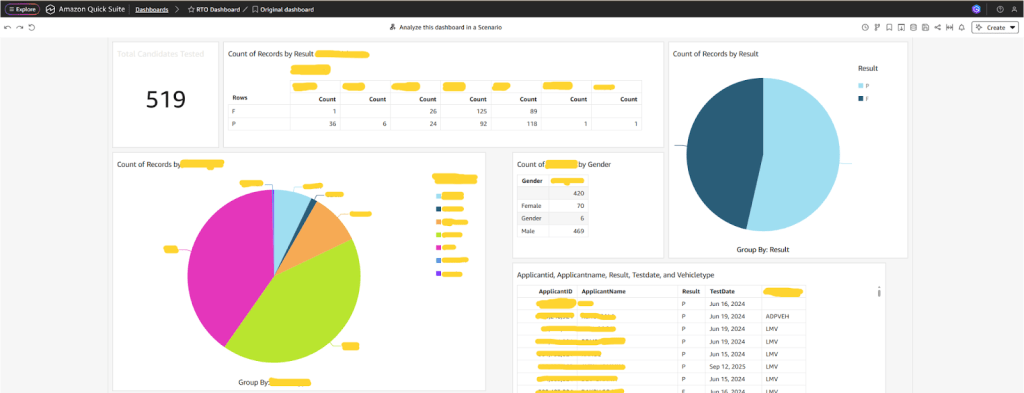
Real-World Implementation: Client Case Study
Client Requirements Overview
A leading enterprise client approached us with a complex data visualization challenge that perfectly demonstrates Quick Suite’s capabilities. The organization had been struggling with fragmented data visibility across multiple operational departments, with critical business data scattered across various Amazon RDS instances.
Primary Requirements:
- Unified Dashboard: Single pane of glass for all operational data
- Real-time Monitoring: Live updates from multiple RDS databases
- Cross-functional Analytics: Department-specific views within unified interface
- Automated Reporting: Scheduled insights for different stakeholder groups
- Mobile Accessibility: Dashboard access for field operations teams
Technical Architecture Implementation
Data Source Configuration:
The client’s infrastructure consisted of multiple Amazon RDS instances containing:
- Operational metrics databases
- Customer interaction data
- Financial reporting data
- Historical analytics warehouse
Quick Suite Integration Strategy:
Data Flow Architecture:
RDS Instances → Direct Connect → SPICE Engine → Unified Dashboard
↓
Quick Research → Automated Insights → Stakeholder Reports
↓
Quick Flows → Alert System → Action Triggers
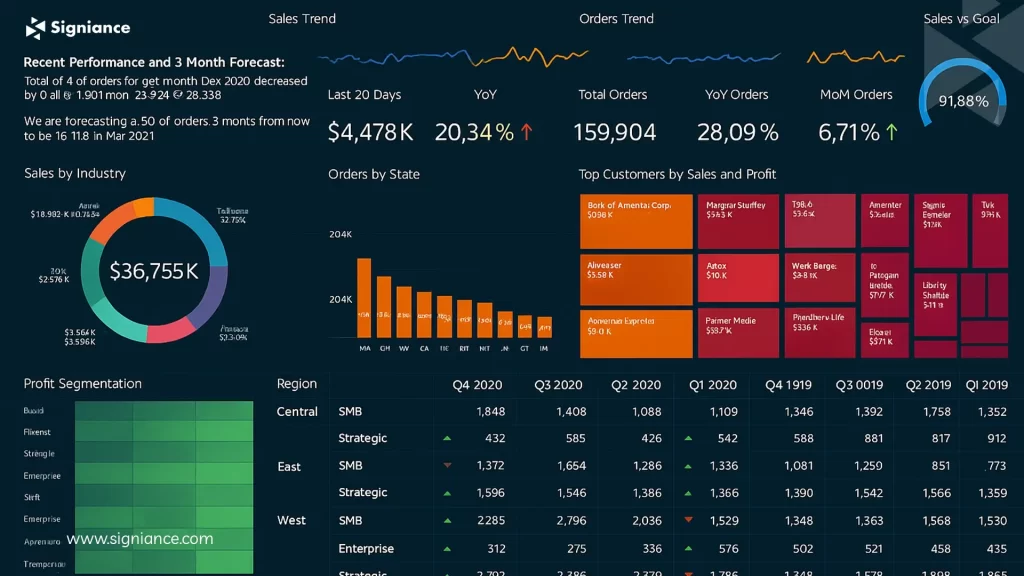
Dashboard Design and Implementation
Unified Dashboard Components:
Executive Summary Panel:
- KPI Cards: Real-time operational efficiency metrics
- Trend Analysis: 30-day rolling performance indicators
- Alert Status: Critical issue monitoring with color-coded status
- Regional Overview: Geographic performance heat maps
Operational Monitoring Section:
- Live Data Feeds: Real-time updates from RDS sources
- Resource Utilization: Capacity planning visualizations
- Performance Metrics: Response time and throughput monitoring
- Predictive Analytics: ML-powered demand forecasting
Financial Performance Area:
- Revenue Tracking: Multi-dimensional revenue analysis
- Cost Analytics: Operational expense monitoring
- ROI Calculations: Investment performance metrics
- Budget Variance: Planned vs. actual spending analysis
RDS Integration Deep Dive
Direct Database Connectivity:
Quick Suite’s enhanced RDS integration eliminates the need for ETL processes in many scenarios. The direct query capability allows real-time dashboard updates while maintaining optimal performance through intelligent caching.
Connection Optimization:
- Connection Pooling: Efficient database connection management
- Query Optimization: Automatic SQL query enhancement
- Data Compression: Reduced bandwidth usage for remote dashboards
- Security Integration: VPC and IAM-based access controls
AI-Powered Insights Implementation
Quick Research Integration:
The client implemented automated insight generation that combines operational data with external industry benchmarks. Quick Research analyzes patterns across multiple RDS databases and provides contextual intelligence:
- Performance Benchmarking: Comparison against industry standards
- Anomaly Detection: Automated identification of unusual patterns
- Trend Prediction: ML-based forecasting for capacity planning
- Root Cause Analysis: Automated investigation of performance issues
Example Automated Insight:
“Regional performance in the Northeast corridor shows 15% improvement over last quarter,
outpacing industry average by 8%. Contributing factors include optimized routing algorithms
implemented in Q2 and reduced maintenance downtime. Recommend scaling this approach to
Western regions where similar patterns could yield 12% efficiency gains.”
Workflow Automation Success
Quick Flows Implementation:
The client deployed automated workflow responses to dashboard alerts :
Alert → Action Workflows:
- Performance Threshold Breach → Automatic notification to operations team + resource scaling request
- Customer Satisfaction Drop → Generate detailed analysis report + schedule management review
- Cost Variance Alert → Financial team notification + budget reconciliation trigger
- System Anomaly Detection → Technical team alert + diagnostic data collection
Natural Language Workflow Example:
User Request: “When daily operational efficiency drops below 85%, notify the regional managers,
create a performance analysis report, and schedule a team meeting for the next business day.”
Generated Workflow:
1. Monitor efficiency KPI from RDS dashboard
2. Trigger when metric < 85% for 2 consecutive hours
3. Send personalized notifications to regional managers
4. Generate automated performance analysis from Quick Research
5. Create calendar invites for next business day team meeting
6. Attach relevant data visualizations to meeting invite
Measured Business Impact
Operational Improvements:
- Decision Speed: 60% faster response to operational issues
- Data Accessibility: 90% reduction in time to access cross-departmental metrics
- Report Generation: Automated reporting reduced manual effort by 80%
- Mobile Access: 100% of field teams now have real-time dashboard access
Cost Optimization Results:
- Infrastructure Savings: 40% reduction in BI tool licensing costs
- Development Efficiency: 70% faster dashboard creation with AI assistance
- Maintenance Reduction: 50% less time spent on report maintenance
- Training Costs: 65% reduction in user training requirements due to intuitive interface
Implementation Lessons Learned
Technical Considerations:
- RDS Connection Limits: Implement connection pooling for high-volume dashboards
- SPICE Optimization: Strategic use of SPICE for frequently accessed aggregations
- Security Planning: Comprehensive IAM role configuration for multi-department access
- Performance Monitoring: Continuous query performance optimization
Organizational Change Management:
- Stakeholder Engagement: Early involvement of all departmental users
- Training Strategy: Role-based training focusing on specific dashboard sections
- Feedback Loops: Regular user feedback integration for dashboard improvements
- Success Metrics: Clear KPIs for measuring dashboard adoption and effectiveness
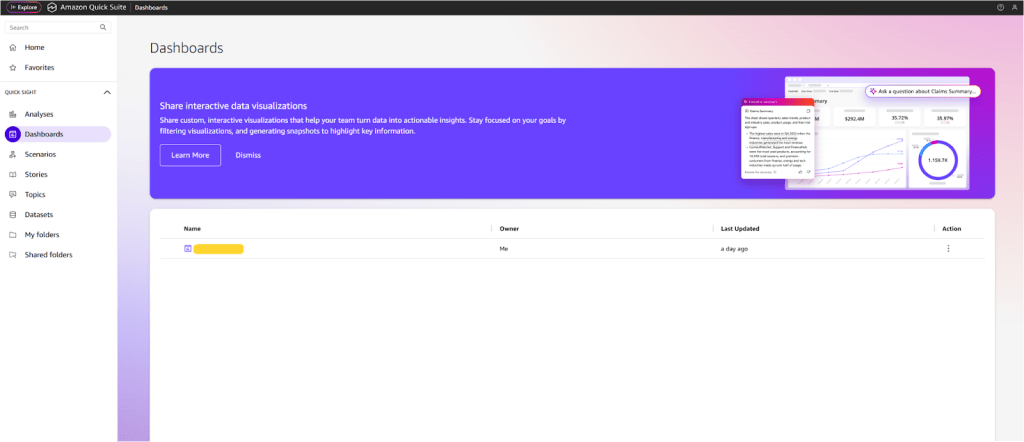
Quick Sight: Enhanced BI Capabilities
Core BI Features Retained
All existing QuickSight functionality remains intact within Quick Suite, including:
Data Connectivity: Support for 50+ data sources including Amazon S3, Redshift, RDS, Athena, and on-premises databases. The enhanced connectors now feature intelligent data profiling that automatically suggests optimal data types and relationships.
SPICE Performance: The in-memory calculation engine now includes adaptive caching that learns query patterns and pre-computes frequently accessed aggregations.
AI-Enhanced Dashboard Creation
The new AutoGraph 2.0 leverages generative AI to create contextual visualizations based on business intent rather than just data types. Users can describe their analytical needs in natural language, and Quick Suite generates appropriate charts with explanatory insights.
Example: “Show me regional sales performance with trend analysis” automatically generates:
- Geographic heat maps for spatial context
- Time-series charts with trend lines
- Comparative bar charts with variance indicators
- Anomaly detection highlights for unusual patterns
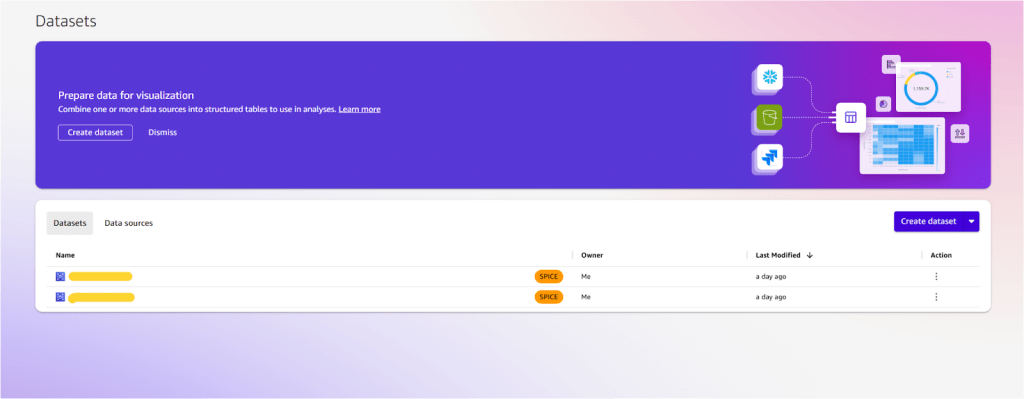
Dataset Management Evolution
Quick Suite introduces Smart Datasets that automatically maintain data lineage, suggest refreshes based on usage patterns, and provide impact analysis for schema changes. The enhanced dataset interface includes:
Automated Data Quality Monitoring: Real-time validation rules with ML-powered anomaly detection
Intelligent Joins: AI-suggested relationships based on semantic analysis
Version Control: Automatic dataset versioning with rollback capabilities
Performance Optimization: Query optimization suggestions based on usage analytics
Quick Research: Enterprise Knowledge Synthesis
Technical Implementation
Quick Research operates as an agentic research assistant that combines enterprise data with curated external sources. The system uses Retrieval-Augmented Generation (RAG) architecture to provide comprehensive, cited insights from multiple knowledge domains.
Data Sources Integration:
- Internal: Quick Index, databases, document repositories, email systems
- External: Industry reports, market data, regulatory databases, academic sources
- Real-time: API feeds, news services, social media monitoring
Research Agent Capabilities
The research agents operate with 4-hour consumption units and provide:
Comprehensive Analysis: Multi-source data synthesis with automatic citation generation
Contextual Intelligence: Industry-specific insights tailored to user queries
Trend Analysis: Historical pattern recognition with predictive indicators
Competitive Intelligence: Market positioning analysis with peer comparisons
Quick Flows: Workflow Automation Revolution
Natural Language Process Design
Quick Flows enables conversational workflow creation where users describe business processes in natural language, and the system generates executable automation workflows. This represents a fundamental shift from traditional drag-and-drop workflow builders to intent-based automation design.
Example Workflow Creation:
User Input: “When monthly sales reports are generated, send them to regional managers, update the sales dashboard, and create follow-up tasks for underperforming regions”
Generated Workflow:
1. Monitor S3 bucket for new sales reports
2. Parse report data and identify key metrics
3. Generate personalized summaries for each region
4. Send automated emails with regional insights
5. Update dashboard visualizations
6. Create ClickUp tasks for regions below threshold
7. Schedule follow-up reminders for managers
Integration Ecosystem
Quick Flows supports native integrations with popular business applications:
- CRM Systems: Salesforce, HubSpot, Microsoft Dynamics
- Project Management: ClickUp, Jira, Asana, Monday.com
- Communication: Slack, Microsoft Teams, email systems
- Document Management: SharePoint, Google Workspace, Box
Quick Automate: Enterprise Process Orchestration
Advanced Automation Capabilities
Quick Automate handles complex, multi-step business processes that require decision-making, exception handling, and cross-system coordination. Unlike simple workflow tools, Quick Automate incorporates business logic and adaptive responses.
Key Features:
- Conditional Logic: Dynamic process routing based on data conditions
- Exception Handling: Automated error resolution with human escalation
- Multi-System Orchestration: Coordinated actions across enterprise applications
- Compliance Monitoring: Automated audit trails and regulatory reporting
Use Case Example: Financial Reporting Automation
Process: Monthly Financial Close
Trigger: Last business day of month
Steps:
1. Extract data from ERP systems
2. Validate data completeness and accuracy
3. Generate preliminary financial statements
4. Route for departmental review and approval
5. Consolidate feedback and adjustments
6. Produce final reports with executive summaries
7. Distribute to stakeholders and regulatory bodies
8. Update compliance tracking systems
Quick Index: Centralized Knowledge Management
Intelligent Document Processing
Quick Index serves as the enterprise knowledge hub, automatically indexing documents, emails, presentations, and structured data. The system uses advanced natural language processing to extract entities, relationships, and contextual meaning from diverse content types.
Processing Capabilities:
- Document Analysis: PDF, Word, PowerPoint, Excel file processing
- Email Intelligence: Automatic threading and topic extraction
- Database Integration: Structured data indexing with semantic relationships
- Version Management: Automatic document versioning with change tracking
Search and Discovery
Quick Index provides semantic search capabilities that understand intent and context rather than just keyword matching. Users can ask complex questions spanning multiple documents and data sources, receiving comprehensive answers with source citations.
Updated Pricing Strategy and Cost Optimization
Simplified Pricing Model
The new Quick Suite pricing eliminates the complexity of the previous QuickSight model, offering clear value propositions :
Professional Tier ($20/user/month):
- Complete BI viewing and analysis capabilities
- Quick Research and Quick Flows access
- 2 research hours + 2 workflow hours included
- Ideal for analysts and business users
Enterprise Tier ($40/user/month):
- Full dashboard and report authoring
- Quick Automate capabilities
- 4 research hours + 4 workflow hours included
- Designed for power users and developers
Cost Optimization Strategies
Right-Sizing User Tiers: Organizations can optimize costs by carefully matching user needs to appropriate tiers. Most users requiring only dashboard viewing and basic research can utilize the Professional tier.
Agent Hour Management: Monitor agent hour consumption through the built-in usage dashboard to prevent overage charges. Research hours ($6/hour) and workflow hours ($3/hour) can be managed through automated alerts.
Infrastructure Fee Optimization: The $250/month infrastructure fee applies per account, making multi-account strategies important for large organizations.
Implementation Best Practices
Migration from Legacy QuickSight
Phased Approach:
- Assessment Phase: Inventory existing dashboards, datasets, and user roles
- Pilot Deployment: Select representative user groups for initial testing
- Feature Integration: Gradually introduce Quick Research and Quick Flows
- Full Migration: Complete transition with user training and support
- Optimization: Fine-tune configurations and workflows
Security and Governance
Enhanced Security Model:
- Identity Integration: Seamless IAM and Active Directory integration
- Data Governance: Automated data classification and access controls
- Audit Capabilities: Comprehensive logging and compliance reporting
- Encryption: End-to-end encryption for data in transit and at rest
Governance Framework:
- Content Management: Centralized dashboard and report governance
- User Provisioning: Automated user lifecycle management
- Cost Monitoring: Real-time usage tracking and budget alerts
- Compliance Reporting: Automated regulatory compliance documentation
Future Implications and Roadmap
Industry Impact
The evolution to Quick Suite represents AWS’s strategic response to the modern data stack trend, where organizations seek integrated platforms rather than point solutions. By combining BI, automation, and AI research, Quick Suite positions itself as a comprehensive decision support system.
Competitive Positioning
Quick Suite directly competes with Microsoft Power Platform, Tableau with Salesforce Einstein, and emerging AI-powered analytics platforms. The integrated approach provides significant advantages in:
- Reduced Integration Complexity: Single platform eliminates data silos
- Consistent User Experience: Unified interface across all capabilities
- Cost Predictability: Simplified pricing model with included agent hours
Conclusion
Amazon Quick Suite represents a paradigm shift in business intelligence, transforming from reactive reporting to proactive business automation. The integration of agentic AI capabilities with traditional BI creates unprecedented opportunities for organizations to leverage data-driven insights in real-time business processes.
For AWS practitioners and organizations currently using QuickSight, the transition to Quick Suite offers immediate value through enhanced capabilities while maintaining backward compatibility. The simplified pricing model and promotional benefits make this an optimal time to explore the platform’s expanded functionality.
The client implementation case study demonstrates how organizations can achieve unified data visibility across complex, multi-database environments while leveraging AI-powered automation to transform operational efficiency. The combination of real-time RDS integration, intelligent workflow automation, and predictive analytics positions Quick Suite as a comprehensive solution for modern enterprise analytics needs.
The evolution from QuickSight to Quick Suite signals AWS’s commitment to comprehensive business intelligence platforms that not only visualize data but also actively participate in business decision-making and process automation. This transformation positions organizations to leverage AI not just for insights, but for intelligent action.