Understanding Application Performance Monitoring: Beyond Basic Health Checks

Imagine your application is a car. A basic health check is like turning the key and hearing the engine sputter to life. Application Performance Monitoring (APM), on the other hand, is more like taking that car out for a spin on the open road. It's about analyzing how it handles curves, how efficiently it uses fuel, and even how comfortable the passengers are. It's not just about asking, "Does it work?" It's about diving deeper and asking, "How well does it work, and how can we make it work better?"
This shift in perspective is essential in today's fast-paced online world. Users expect a smooth, seamless experience. A slow-loading page or a buggy checkout process can quickly lead to frustration and lost customers. APM provides the insights you need to pinpoint and fix these problems before they impact your users. Think about a customer trying to buy a product on your website. APM can track every click, every page load, highlighting any slowdowns, like a sluggish database or a third-party service that's holding things up.
APM has also moved beyond simply reacting to problems. Modern APM tools use AI and machine learning to proactively spot potential issues and even predict when users might get frustrated. This means you can fix problems before users even notice them, let alone complain.
The Growth of APM in India
This proactive approach is gaining a lot of traction, especially in India. The application performance management market there is expected to grow at a CAGR of 17.4% between 2025 and 2030. Discover more insights about the APM market in India This growth highlights how crucial APM is for businesses facing increasingly complex IT systems and the ever-present demand for high-performing applications. Understanding APM isn't just about keeping your applications online; it's about understanding and optimizing the whole user experience. It's about ensuring customer satisfaction, and ultimately, driving business growth.
Metrics That Actually Drive Business Decisions
So, you're looking into Application Performance Monitoring (APM)? Great! It's more than just seeing if your app is up; it's about understanding how it performs and affects your users. Think of it like checking your car's engine – you don't just want it to start, you want it to run smoothly and efficiently. Choosing the right metrics is like picking the right gauges on your dashboard. A flashy dashboard is useless if it doesn't show you what you need to know.
Let's say you're running an e-commerce site during a big sale. A key metric here would be the average order value. If your APM shows slowdowns during checkout, and you see that coinciding with a drop in average order value, that's a direct hit to your bottom line. That's much more useful than just seeing high server CPU usage, which might not be directly impacting sales.
Identifying Key Metrics
Effective APM is all about aligning your metrics with your business goals. A 500ms response time might be fine for browsing products, but during checkout, even a 200ms delay could send customers running. So, what should you watch?
-
Transaction Success Rate: This tells you what percentage of transactions complete successfully, directly reflecting happy customers and revenue. For a payment gateway, like Stripe, a 99.99% success rate is critical.
-
Error Rate: High error rates point to bugs or infrastructure issues. Monitoring specific error codes can help you find and fix problems faster. Think of it like a check engine light – you need to know why it's on.
-
Page Load Time: This is especially vital for e-commerce or content-heavy sites. Slow page loads hurt user experience and SEO. Imagine waiting ages for a page to load – frustrating, right?
-
Apdex Score: This measures user satisfaction with response times, offering a more complete picture than just average response time. It’s like asking your customers how their experience was, not just assuming it was fine based on average wait times.
You'll also want to keep an eye on technical metrics like CPU utilization, memory usage, and database query times. But always connect these back to their impact on the user experience and your business goals. Don’t get lost in the technical details – always ask, "How does this affect my users and my business?"
To help you compare these essential metrics, take a look at the following table:
Essential APM Metrics Comparison: A comprehensive comparison of key APM metrics, their importance levels, typical benchmarks, and business impact
| Metric | Description | Typical Benchmark | Business Impact | Monitoring Priority |
|---|---|---|---|---|
| Transaction Success Rate | Percentage of completed transactions | >99.9% (depending on industry) | Directly impacts revenue and customer satisfaction | High |
| Error Rate | Percentage of failed requests | <1% | Indicates system instability and potential bugs | High |
| Page Load Time | Time taken for a page to fully load | <3 seconds (ideally <2 seconds) | Impacts user experience and SEO | High |
| Apdex Score | User satisfaction with response times | >0.9 (depending on industry) | Measures user experience and identifies performance bottlenecks | High |
| CPU Utilization | Percentage of CPU capacity used | <80% (sustained) | Indicates potential resource constraints | Medium |
| Memory Usage | Amount of memory used by the application | Varies depending on application | Indicates potential memory leaks or inefficient code | Medium |
| Database Query Times | Time taken to execute database queries | <100ms (depending on query complexity) | Impacts application performance and user experience | Medium |
This table provides a quick overview of the key metrics you should be tracking and how they impact your business. Remember to adjust benchmarks and priorities based on your specific application and industry.
Choosing and monitoring the right metrics is key. It's not about the amount of data, but the insights you get from it. Just like a skilled mechanic knows which gauges to watch, you need to focus on the metrics that tell you the most about your application’s health and performance.
Real User Monitoring Vs. Synthetic Monitoring: The Full Story

This screenshot from Wikipedia shows how Real User Monitoring (RUM) gathers data directly from users' browsers. Think of it as a direct line to understanding what your users are actually experiencing. It’s not just about speed, but also context: what browser are they using? What’s their operating system? RUM paints a much richer picture of how people interact with your application.
Think of trying to understand traffic in a city. You could place cameras at key intersections (that’s like synthetic monitoring) or you could put sensors in the cars themselves (that’s RUM). Both are useful, but they tell different sides of the story.
Synthetic monitoring offers consistent, controlled insights. It's like a regular health check for your application – scheduled and predictable. It's great for spotting trends and potential problems before they impact your users. These checks use simulated requests to monitor your applications and infrastructure, giving you a baseline of what performance should look like.
Understanding Real User Monitoring (RUM)
RUM, on the other hand, captures the real-world experience of your users. It’s the raw, unscripted data that tells you how your application performs across different devices, networks, and locations. This means RUM can uncover hidden performance bottlenecks that synthetic monitoring might miss. Think slow loading times on a particular mobile network or problems with an older browser version. This real-world data, while sometimes messy, is incredibly valuable.
Combining RUM and Synthetic Monitoring for Comprehensive APM
The best approach? Use both! RUM and synthetic monitoring work together, not against each other. Synthetic monitoring provides a baseline and catches potential issues early. RUM adds the essential layer of actual user experience, showing you how performance really impacts your users and where you should focus your optimization efforts.
The importance of this comprehensive approach is reflected in the growth of the application performance monitoring (APM) software market. In India, for example, the sector is projected to grow at a CAGR of 18.2% from 2025 to 2030. Interestingly, RUM holds the largest revenue share within this market, at 31.58% in 2024. Explore the expanding APM landscape in India. This trend highlights the growing need for robust APM strategies.
Choosing the Right Balance
The ideal mix of RUM and synthetic monitoring depends on your specific needs. For mission-critical applications, a robust combination of both is crucial. For less critical applications, you might take a lighter approach. The key is to strike a balance that gives you a complete view of both application performance and user experience. This allows you to address both the expected and the unexpected, ensuring a consistently good experience for everyone.
Mastering Cloud and DevOps Monitoring Realities
Cloud computing and DevOps have drastically changed how we build and run applications. This shift brings new challenges to application performance monitoring (APM). Imagine trying to keep tabs on a fleet of cars that constantly change routes, speeds, and even the number of vehicles. Traditional monitoring tools, built for static environments, struggle. They're like using an old map to navigate a busy city.
Traditional monitoring often assumes fixed server locations and predictable traffic. In the cloud, resources scale dynamically, and applications spread across multiple microservices. These old assumptions no longer apply. Pinpointing performance bottlenecks and understanding user impact becomes much harder. It's like diagnosing a car problem when the engine parts are scattered across different garages.
Embracing Dynamic Environments with Modern APM
This is where modern APM excels. It embraces the dynamic cloud and DevOps world by focusing on observability. Instead of relying on pre-set metrics, it gathers data from the entire application ecosystem—logs, metrics, and traces. This gives a complete picture, allowing teams to understand not just what's happening, but why.
This shift to observability is vital for DevOps teams. By integrating monitoring into their pipelines, they make informed release decisions. Real-time performance data enables crucial go/no-go calls, preventing problems from affecting users. This creates valuable feedback loops, letting developers boost both performance and development speed. It's like a real-time diagnostic system, alerting the driver before a breakdown. Teams looking to improve their DevOps processes can check out resources on DevOps automation.
Addressing the Challenges of Modern Monitoring
Modern APM tackles the specific challenges of distributed tracing in microservices and managing monitoring overhead in containers. Tracing a request through a single application used to be straightforward. With microservices, a single request might hit dozens of services, making tracing far more complex. Modern APM tools offer distributed tracing, allowing developers to follow a request across all services. Think of it like tracking a package's every stop across the country.
The rise of cloud computing and DevOps has fueled major growth in the APM market. Globally, the market is expected to hit $17.71 billion by 2029, with a CAGR of 13.2%. This growth is driven by the increasing use of cloud technologies and microservices. Discover more insights into the global APM market. Building monitoring strategies that scale with your infrastructure is crucial. Choose tools and approaches that can handle the growing data from dynamic cloud environments without creating bottlenecks. It's like a traffic management system that adapts to changing traffic flow, ensuring smooth sailing even at rush hour. Successfully navigating these complexities is key to unlocking the full power of cloud and DevOps.
Choosing APM Tools That Actually Fit Your Reality
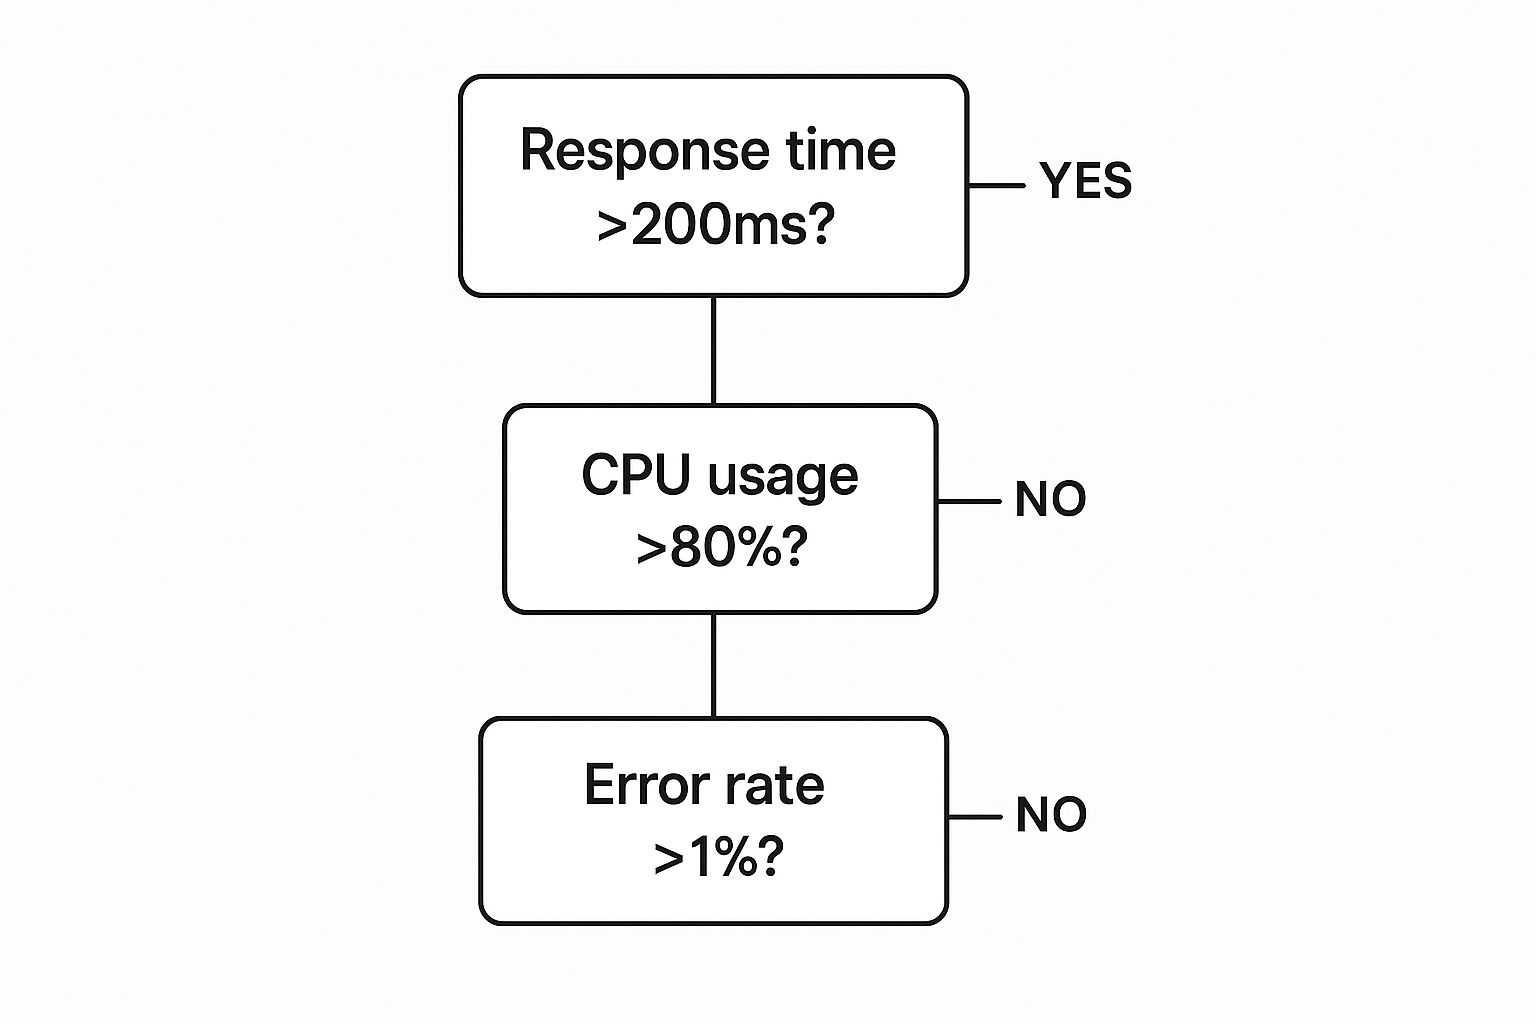
The infographic above shows a simplified way to troubleshoot application performance. Think of it like a flowchart: start with response time. If that's high, check the CPU usage. If CPU is fine, look at the error rate. This visualization, though simple, shows how these metrics relate and how a methodical approach helps find performance bottlenecks. But real-world APM tool selection is more nuanced than a simple flowchart. Feature lists are tempting, but they don't tell the whole story. Teams often get caught up in the excitement, only to face implementation struggles later.
Let's get practical. Instead of chasing every feature, focus on how your team will actually use the tool. Consider the everyday realities: how easy is it to integrate? What’s the learning curve? How much will it cost to maintain?
Navigating the APM Landscape
The APM market is a diverse ecosystem. Some platforms offer comprehensive monitoring, from infrastructure to user experience. Think of these as the all-in-one toolkits. Others focus on specific niches like real user monitoring (RUM) or database performance. Understanding these categories is crucial. A startup with a single web app has different needs than an enterprise with a complex microservices architecture.
Imagine a team migrating to the cloud. A platform promising seamless cloud integration sounds appealing. But what if the team isn't ready for such a complex tool? A more focused solution targeting their immediate cloud monitoring needs might be a smarter move. This allows them to get comfortable with cloud monitoring before scaling to a more comprehensive solution. You might be interested in our guide on cloud adoption strategy.
Building a Realistic Evaluation Framework
Choosing the right tool goes beyond flashy vendor demos. Your evaluation criteria should reflect your real needs, not a wish list.
-
Ease of Integration: How easily does the tool fit into your existing systems? A complex integration can cause delays and headaches.
-
Learning Curve: How fast can your team learn the tool? A steep learning curve can hinder adoption.
-
Total Cost of Ownership: Don't just look at the sticker price. Factor in ongoing maintenance, training, and support. A "cheap" tool can get expensive quickly.
-
Scalability: Can the tool grow with your business? Choosing a scalable tool avoids costly replacements later.
To help you evaluate APM tools effectively, we've put together a comparison matrix. It highlights key differences between enterprise-grade solutions, mid-market tools, and open-source options.
APM Tool Selection Criteria Matrix
A detailed comparison matrix for evaluating APM solutions based on key business and technical criteria
| Criteria | Weight | Enterprise Tools | Mid-Market Solutions | Open Source Options |
|---|---|---|---|---|
| Ease of Integration | High | Typically complex, requiring specialized expertise. | Easier integration with common platforms. | Varies widely; can be complex depending on the specific tool and your environment. |
| Learning Curve | High | Steep learning curve due to advanced features. | Moderate learning curve; generally user-friendly. | Can be steep, requiring significant technical expertise. |
| Total Cost of Ownership | High | Highest cost due to licensing, maintenance, and support. | Moderate cost; offers a balance between features and price. | Lowest initial cost, but potential hidden costs in terms of setup, maintenance, and community support. |
| Scalability | High | Designed for large-scale enterprise environments. | Scalable to a certain extent, but may have limitations for very large deployments. | Scalability varies widely; some options are highly scalable, while others are less so. |
| Features & Capabilities | High | Comprehensive feature set covering all aspects of APM. | Offers a good balance of features, but may not have the depth of enterprise tools. | Feature sets vary; some offer basic features, while others provide advanced capabilities. |
This matrix is a starting point. Remember to weigh the criteria based on your specific circumstances. For example, a rapidly growing startup might prioritize scalability over cost. A large enterprise with a complex environment might prioritize features and integrations over ease of use.
By focusing on practical factors, you choose a tool that truly adds value, not just another unused license. This thoughtful approach sets you up for successful implementation and, ultimately, improved application performance.
Implementation Strategies That Survive First Contact

The image above depicts a rocky, alien landscape—a fitting metaphor for the start of many Application Performance Monitoring (APM) implementations. Imagine making first contact with a new civilization. An aggressive approach might trigger a defensive reaction. Similarly, thrusting a complex APM tool onto a team without proper preparation can lead to resistance and ultimately, failure. This section explores implementation strategies that focus on people as much as technology.
Building Buy-In: From Overhead to Value Creation
Many stakeholders initially perceive APM as just another expense. It's like trying to convince someone to buy a gym membership; they see the upfront cost but not the long-term health benefits.
To build genuine buy-in, start by showcasing the value of APM. Show how it directly helps the team achieve their specific goals, not just meet some abstract performance targets.
For example, connect APM data to business metrics like conversion rates or customer satisfaction. Suddenly, APM isn't an overhead; it's a tool for boosting the bottom line.
Instrumenting Applications: The Gentle Approach
Think of instrumenting applications like installing sensors in a car. Done right, it provides valuable data without affecting performance. Over-instrumenting, however, can slow things down, much like too many sensors can drain a car battery.
Start with a minimal set of key metrics. Gradually add more as needed. This reduces the risk of performance issues and prevents the team from feeling overwhelmed.
Setting Up Alerts: Help, Not Hindrance
Alerts are like a car's warning lights—crucial for spotting problems. But too many false alarms become annoying and distracting. This leads to alert fatigue, where teams begin ignoring all alerts, defeating the purpose of monitoring.
Carefully tune your alert thresholds. Prioritize critical alerts and suppress unnecessary notifications. For example, alert on trends and patterns rather than individual, transient spikes in metrics. The goal is to provide helpful insights, not to bombard your team with noise.
Piloting Success: Start Small, Scale Smart
Many teams try to implement a full APM solution all at once. This "big bang" approach is often fraught with frustration and setbacks. It's like trying to learn a language by memorizing a dictionary overnight.
A more effective strategy is to start with a small pilot project. Choose one critical application or service, implement APM, and demonstrate its value. Use the lessons learned from this pilot to refine your approach and then expand to other parts of your system. This iterative process is less risky and helps teams gain confidence and expertise before tackling larger implementations.
Avoiding Pitfalls: Over-Monitoring and Under-Monitoring
Over-monitoring creates a deluge of noise, while under-monitoring leaves you blind to critical problems. Finding the right balance is like adjusting the sensitivity of a car alarm. Too sensitive, and it goes off for every passing squirrel. Not sensitive enough, and it won’t trigger when your car is actually being stolen.
Successful APM implementation requires careful planning and continuous refinement. Regularly evaluate your monitoring strategy. Adjust your metrics, alerts, and processes based on your team's evolving needs and the changing demands of your application. This adaptive approach ensures that your APM implementation remains a valuable asset, not a burden.
Your Roadmap to Monitoring Success
So, you've got a handle on the "what" and "why" of Application Performance Monitoring (APM). Excellent! Now, let's talk about the "how"—turning that knowledge into a practical plan that works for your specific needs. Think of this less as a rigid checklist, and more as a flexible guide based on what really works in the field.
Prioritizing For Impact, Not Complexity
Imagine you’re a detective solving a case. You wouldn't start by dusting every single object in the room, would you? You'd focus on the key pieces of evidence first. Similarly, prioritize your monitoring efforts based on potential business impact, not just how technically challenging they are. For example, monitoring your checkout process (which directly impacts sales) might be more valuable initially than trying to monitor your entire backend infrastructure. Focus on what matters most to your bottom line.
Monitoring your checkout process, which directly impacts revenue, may be more worthwhile than the complexity of monitoring your entire backend infrastructure. Start with the most critical processes.
Realistic Timelines For Implementation
Just like some recipes take longer to cook than others, different APM implementations have different timelines. Setting up a basic Real User Monitoring (RUM) solution might take a few weeks, while a comprehensive observability platform could take months. Understanding these timelines upfront is crucial for setting realistic expectations, especially when communicating progress to stakeholders. No one likes a surprise soufflé collapse.
RUM integrations may only take weeks, while setting up a full-stack platform could take months. Understand these timelines and communicate them to stakeholders.
Action Items: Getting Started Today
No matter where you are in your monitoring journey, here are a few things you can do right now:
- Identify Key Business Metrics: What truly matters to your business? Is it transaction success rate, page load times, or something else entirely?
- Assess Your Current Monitoring: What are you already monitoring? What's missing? Are you getting the insights you actually need?
- Choose a Pilot Project: Start small. Pick one critical application or service to focus on for your initial APM implementation. Think of it as a test kitchen for your monitoring strategy.
- Engage Your Team: Get everyone on board early. Explain the value of APM and how it will directly benefit them and their work.
Measuring ROI and Communicating Value
APM isn't just a cost; it's an investment. To justify that investment, you need to show its return. Track how APM improves key metrics like conversion rates, customer satisfaction, and revenue. When communicating these improvements, speak the language of business outcomes, not technical jargon. For example, instead of saying “we reduced average response time by 100ms,” try “we improved conversion rates by 5% by speeding up the checkout process.” This makes the value clear and tangible. You might be interested in our guide on cloud security assessment.
Recognizing Warning Signs and Measuring Success
How can you tell if your current approach is off track? Here are some red flags:
- Alert Fatigue: Are your teams drowning in alerts, leading to important ones being missed?
- Lack of Insights: Are you collecting data but not getting actionable information from it?
- Resistance to Change: Are teams reluctant to adopt new monitoring practices?
On the other hand, here are some signs of success:
- Reduced Mean Time to Resolution (MTTR): Are you fixing issues faster?
- Improved User Experience: Are users happier with your application's performance?
- Increased Business Value: Are you seeing a positive impact on your bottom line?
By following this roadmap, you can navigate the complexities of APM implementation and achieve real, measurable results. Turn your monitoring from a reactive chore into a proactive strategy for success.
Ready to elevate your cloud strategy? Learn how Signiance Technologies can help you optimize performance, enhance security, and achieve your business goals with our comprehensive cloud and DevOps solutions. Visit Signiance Technologies today.