Finding What’s Actually Slowing Your Database Down
Before you start blaming the hardware or throwing more memory at a problem, it’s time to play detective. Proper database performance tuning isn’t about guesswork; it’s about systematically figuring out what’s causing the slowdown. More often than not, the real culprit is hiding in plain sight, maybe as a poorly written query or a simple configuration mistake. It’s like a doctor diagnosing an illness they don’t just hand out medicine without understanding the symptoms first. We need to do the same and gather evidence from our database to make smart decisions.
This whole process kicks off with setting a performance baseline. If you don’t know what “normal” performance looks like for your system, how can you spot something that’s genuinely “abnormal”? Once you have that baseline, you can start investigating the usual suspects: resource contention, inefficient queries, and less-than-ideal configurations. Your database itself holds the best clues, offering tools like execution plans and wait statistics.
Reading the Signs: Execution Plans and Wait Stats
Think of an execution plan as your database’s game plan for fetching data. Learning to read one is like getting a peek into your database’s thought process. It will show you if it’s taking a smart shortcut with an index scan or taking the long way with a full table scan, which is often a major performance drain.
The image below gives a good idea of the different parts that play a role in database performance tuning, showing how everything connects to affect system speed.
This visual shows that tuning isn’t a one-and-done fix. It’s a continuous cycle of watching, finding problems, and making targeted improvements.
Just as critical are wait statistics. These stats tell you exactly what your database is spending its time waiting for. Is it waiting on the CPU, the disk I/O, or for locks to be released? This information points you straight to resource shortages. For example, high “CXPACKET” waits in SQL Server might signal issues with parallelism, while major “I/O” waits suggest your storage is struggling to keep up. Focusing on the biggest wait events first is a solid strategy for putting your efforts where they will make the most difference.
Proactive Monitoring for Real-World Gains
This kind of detective work is more important than ever. As data-heavy industries grow, keeping an eye on performance proactively is essential. For instance, in India’s fast-growing telecom sector, one major company used real-time monitoring to pinpoint system bottlenecks. The result was a stunning 30% reduction in system downtime, which improved both customer satisfaction and operational efficiency. This real-world case shows how a structured approach to finding issues can lead to real business wins. You can dive deeper into this topic and find other handy tips on the Acceldata blog.
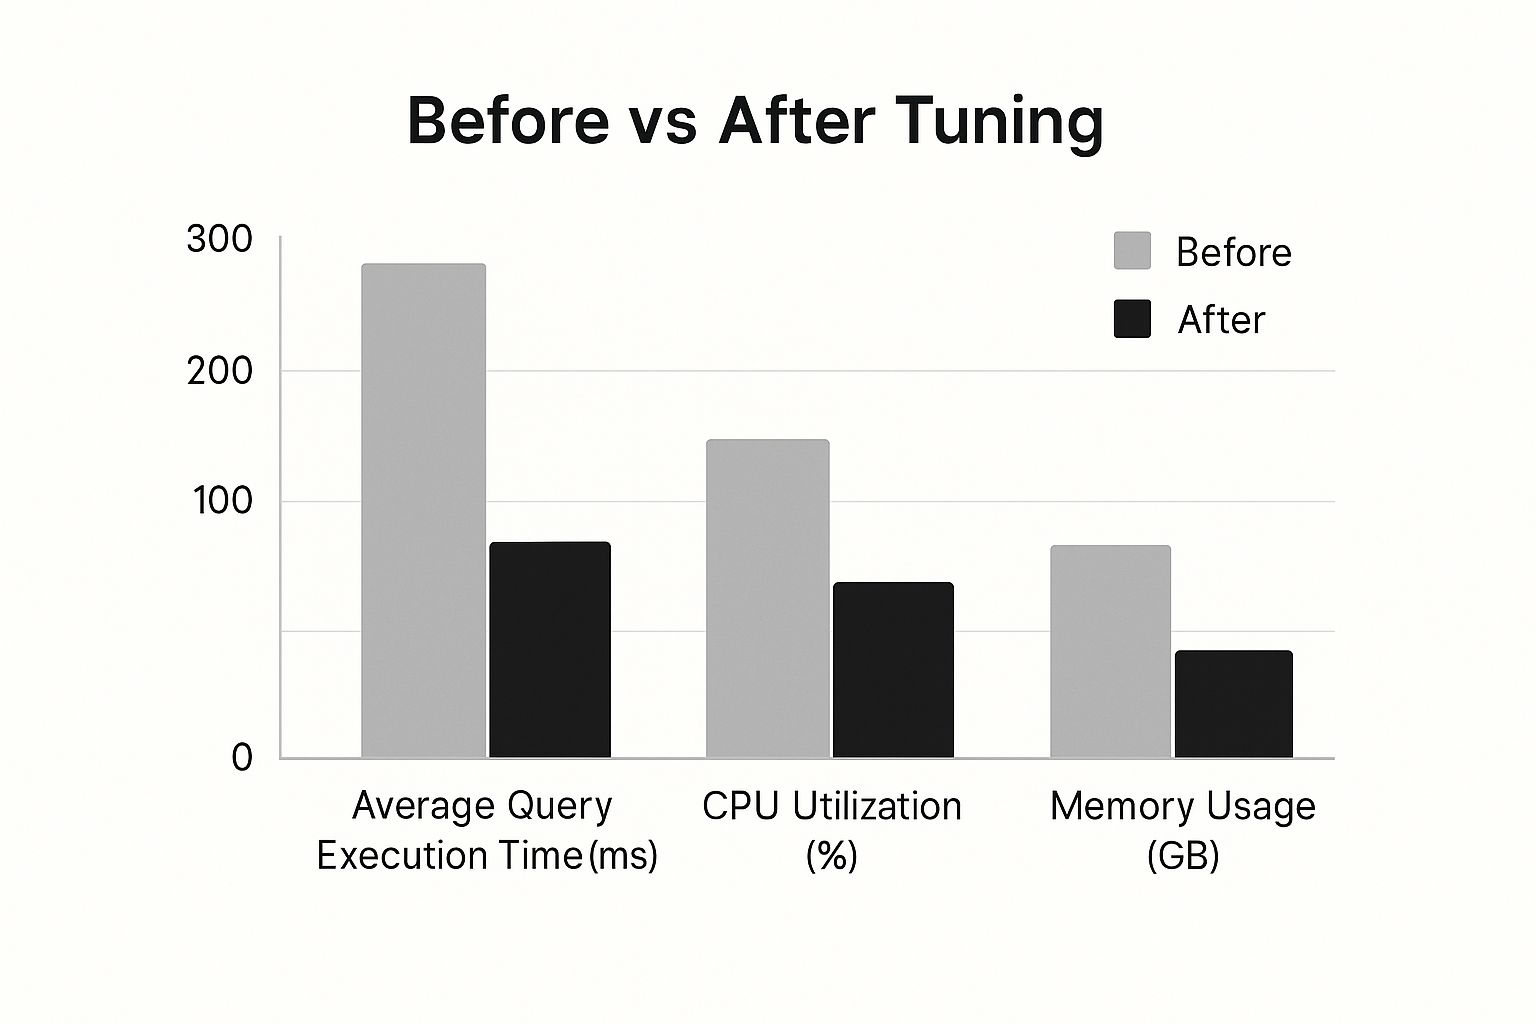
The impact of this analytical approach can be massive. This infographic highlights the typical improvements you might see after a successful tuning project.
As you can see, a focused tuning effort can dramatically slash query execution time while also reducing CPU and memory consumption. It’s solid proof that working smarter often beats simply throwing more powerful hardware at a problem. By methodically tracking down the true bottleneck, you can apply precise, effective fixes instead of making expensive changes based on a hunch.
Transforming Slow Queries Into Performance Winners
Once you’ve found the queries that are slowing things down, the real work of database performance tuning can start. This is where we get practical and turn those sluggish, resource-draining statements into fast, efficient performers. It’s often not about big, dramatic changes but about making small, precise adjustments. I’ve personally seen cases where rewriting a single join or adding a specific hint slashed query times from several minutes down to just milliseconds. The trick is to figure out why a query is slow and then apply the right fix.

It all comes back to the execution plan we looked at earlier. Think of this plan as your treasure map to performance. If you spot a “full table scan” on a table holding millions of records, that’s a major red flag. Your primary objective is to guide the database toward a more efficient route, which usually involves using an index.
Sometimes, the solution is as simple as making your query SARGable, which stands for “Search-Argument-able.” This just means writing your WHERE clauses in a way that allows the database to directly use an index. For instance, a condition like WHERE YEAR(order_date) = 2024 will often stop the database from using an index on the order_date column because it has to run a function on every single row first. However, if you rewrite it as WHERE order_date >= '2024-01-01' AND order_date < '2025-01-01', the database can use a much quicker index range scan to find the data.
The Art of Joins and Rewrites
How you join your tables can be the difference between a query that flies and one that crawls. A classic example is an INNER JOIN between a massive transaction table and a much smaller customer table. The database has different strategies for this, like a nested loop, a hash join, or a merge join. While the optimiser usually makes a good choice, it can sometimes get it wrong. This is where your expertise shines. By studying the plan, you might find that forcing a different join strategy with a query hint can lead to huge improvements, especially if the table statistics are outdated.
But hold on before you start scattering hints everywhere. They should be your last resort, not your first instinct. Always start by checking if the query itself can be rewritten to be simpler and more direct. Here are a few practical tips I’ve learned over the years:
- Avoid SELECT *: Be specific about the columns you need. Pulling only the necessary columns reduces data transfer and might allow the database to get everything it needs from an index alone (this is called a “covering index”).
- Deconstruct complex queries: A massive, tangled query with numerous subqueries can confuse the optimiser. Breaking it down into smaller, more manageable pieces using temporary tables or Common Table Expressions (CTEs) can often lead to a better overall execution plan.
- Question the business logic: Step back and ask if the query is doing more work than it needs to. I once worked on an e-commerce dashboard where a query joined six tables just to calculate one KPI. We realised we could pre-calculate and store this value. This change replaced a monster query with a simple lookup, and the performance boost was incredible.
A Practical Comparison of Techniques
Choosing the right optimization method depends on the specific bottleneck you’re facing. To help you decide, here’s a table comparing some of the most common approaches.
| Technique | Performance Impact | Implementation Difficulty | Best Use Case |
|---|---|---|---|
| Index Optimisation | High | Low to Medium | Slow WHERE clauses or JOIN conditions. |
| Query Rewriting | High | Medium | Complex, inefficient logic or non-SARGable queries. |
| Using Query Hints | Variable | Medium to High | Forcing a specific plan when the optimiser fails. |
| Schema Denormalisation | Very High | High | Read-heavy systems where join costs are too high. |
This table shows that while simple index changes can have a big impact with low effort, more advanced techniques like denormalisation require careful planning but can offer the biggest performance gains in the right situations.
Ultimately, optimising queries is an iterative cycle. You analyse the execution plan to form a theory, make a change, measure the outcome, and then repeat the process. It’s a valuable skill that has a direct, positive effect on user experience and system reliability, making it a foundation of solid database management.
Building Indexes That Actually Improve Performance

When we discuss database performance tuning, indexes are almost always the first thing that comes to mind, and for good reason. Think of a database index like the index in a textbook; it helps the system pinpoint specific data without having to read through every single row. However, creating indexes that truly boost performance is more of an art form. A common mistake is to just add an index to every column used in a filter, which can surprisingly make things worse.
The actual aim is to craft indexes that align perfectly with your most common and resource-intensive queries. It’s a careful balancing act. While every index you add can speed up read operations for certain queries, it introduces a new cost. Every INSERT, UPDATE, or DELETE command now carries an extra burden, as it must also modify each relevant index. This write overhead can bring a system with high transaction volumes to its knees. I’ve personally seen production databases where over-indexing led to slower write times, causing application timeouts the very problem we were trying to solve.
When Indexes Hurt More Than They Help
So, how can you sidestep this common trap? The answer lies in being selective and strategic. Before you even draft a CREATE INDEX statement, you need to pinpoint the queries that stand to gain the most. Your primary targets are slow queries performing full table scans on large tables.
Even with a clear target, you need to be cautious. Watch out for these frequent issues:
- Low-Cardinality Columns: Indexing a column with only a handful of unique values (for example, a “status” column with just ‘active’ and ‘inactive’ options) is often pointless. The database might calculate that it’s quicker to scan the whole table than to jump between the index and the table data.
- Unused Indexes: Applications and their queries change over time. An index that was once vital can become dead weight, taking up storage and slowing down write operations for absolutely no benefit. Regularly auditing and removing unused indexes is a critical part of database maintenance.
- Wide Indexes: An index with too many columns can become massive. If the index grows too large to fit comfortably in memory, the performance advantages can drop off sharply.
Advanced Indexing: Covering and Filtered Indexes
Once you have a solid grasp of the basics, you can start using more advanced techniques that can be true game-changers for your database’s performance.
A covering index is a fantastic method for optimising workloads that are heavy on reading data. This type of index includes all the columns needed for a particular query right inside the index itself. This allows the database to answer the query just by reading the index, completely avoiding the need to access the main table data. The performance improvement can be massive because it eliminates a secondary lookup, saving significant I/O. For instance, if you often run SELECT user_id, email FROM users WHERE last_name = 'Kumar', creating an index on (last_name, user_id, email) could make that query incredibly fast.
Another effective technique is the filtered index (sometimes called a partial index). This lets you create an index on a specific subset of rows in a table. Suppose you have a huge orders table, but your application only ever queries for orders that are still ‘pending’. Instead of indexing the status of every single order, you could create a filtered index with a condition like WHERE status = 'pending'. This creates a much smaller, more efficient index that’s quicker to both query and maintain. It’s a perfect illustration of strategic database performance tuning that provides maximum impact with minimal overhead.
Setting Up Monitoring That Prevents Performance Crises
Waiting for your database to grind to a halt before you do anything about it is a recipe for stress and frantic, late-night fixes. This reactive approach to database performance tuning is like being a firefighter who only gets called out after a building has already collapsed. The goal isn’t just to put out fires; it’s to become the fire inspector who prevents them from starting in the first place. Good monitoring isn’t about collecting every possible metric. It’s about tracking the right things and setting up smart alerts that warn you of trouble without drowning you in noise.
A common trap many teams fall into is chasing “vanity metrics.” Sure, high CPU usage might look scary on a dashboard, but if your application’s throughput is high and query response times are excellent, is it really a problem? It could just mean your system is making great use of its resources. High-performing teams focus on metrics that directly impact user experience and overall system health, not just basic resource utilisation. This is where a broader perspective, often gained through application performance monitoring, becomes invaluable by connecting database activity to specific user actions.
Choosing Metrics That Matter
To build a monitoring strategy that actually helps, you need to learn how to separate the meaningful signals from the background noise. Instead of just staring at CPU and memory charts, your focus should be on the leading indicators of trouble the metrics that start to look unhealthy before a full-blown crisis hits.
Here are a few key areas I always recommend monitoring for genuine insights:
- Query Latency Percentiles: Don’t settle for average response times. You need to look at the 95th and 99th percentiles (often called P95/P99). A stable average can easily hide the fact that a small but important group of users is having a terrible experience with slow queries. A rising P95 is one of the earliest signs that a bottleneck is forming.
- Transaction Throughput: A sudden drop in the number of transactions your database processes per second is a crystal-clear sign that something is wrong, even if other vitals look normal. It directly tells you that the database is doing less work than it should be.
- Index Efficiency: Keep an eye on how your indexes are being used. Are your most critical indexes even being touched by queries? A high number of sequential scans on a large table that you expect to be served by an index is a major red flag. It often means your query plans have changed for the worse.
- Replication Lag: If your setup uses read replicas for scaling, this metric is non-negotiable. A growing delay between your primary database and its replicas can lead to users seeing stale data. In a worst-case scenario, it could jeopardise your entire high-availability strategy.
Moving from Thresholds to Trends
Setting rigid alert thresholds, like “tell me if CPU is over 90% for 5 minutes,” is a classic way to generate a lot of false alarms and alert fatigue. A much smarter approach is to use trend analysis. Instead of a fixed number, your monitoring system should look for deviations from what’s normal for your application. For example, an alert could trigger if the average query latency on a Tuesday morning is 30% higher than it was for the last four Tuesdays. This adaptive method helps you catch subtle performance issues long before they hit a static, arbitrary limit.
Effective monitoring goes hand-in-hand with keeping your database statistics up to date. In India, for example, database administrators in the booming digital economy prioritise key indicators like query response time and transaction throughput to keep their systems running smoothly. You can learn more about how database statistics influence optimisation on Optimizdba.com. By combining updated statistics with intelligent monitoring, you can make tuning decisions based on solid evidence, not just guesswork.
Optimising Configuration For Real-World Performance
While sorting out queries and indexes gives you some targeted performance boosts, it’s your database’s overall configuration that lays the groundwork for everything. It’s quite common to see teams just sticking with the default settings. The problem is, those defaults are made for general use, not for your specific workload. Proper database performance tuning means getting your hands dirty and adjusting those settings to match how your applications actually handle data.
Think of it like getting a race car ready for a track day. You wouldn’t just leave the factory suspension settings as they are. In the same way, your database needs to be set up for its unique job, whether that’s dealing with tons of quick online transactions (OLTP) or running heavy analytical queries (OLAP). Getting the configuration right can squeeze out performance you never knew your hardware had.
Memory Allocation and Connection Management
One of the biggest wins in tuning comes from how you manage memory. The main goal here is to keep your “hot” data the tables and indexes you use all the time in memory. This is handled by what’s called the buffer pool or shared buffers. Sizing this correctly is absolutely vital. If it’s too small, your database is constantly pulling data from the much slower disk. If it’s too big, it can hog memory from the operating system, causing other performance headaches.
A solid approach is to look at what your application does most. For an app that mainly reads data, you might give a large chunk of your server’s RAM, maybe 60-75%, to the buffer pool. But for a system that’s heavy on writing data, you’ll want to be a bit more conservative to leave memory for other background processes.
Just as critical is connection management. Every single connection to your database uses up resources. If your application is constantly opening and closing connections for every little task, it creates a lot of unnecessary work. This is where a connection pooler comes in handy. A tool like PgBouncer for PostgreSQL keeps a set of connections open and ready, slashing the time and resources needed to establish new ones. Poorly managed connections are a frequent cause of bottlenecks and can easily crash an application when traffic spikes.
To help you decide which settings to focus on, here’s a breakdown of key parameters and how they typically affect different database workloads.
| Parameter | OLTP Impact | OLAP Impact | Recommended Range | Tuning Priority |
|---|---|---|---|---|
shared_buffers |
High | High | 25% of RAM (start), up to 75% for read-heavy | High |
work_mem |
Medium | High | 4-16MB (OLTP), 64-256MB+ (OLAP per query) | High |
maintenance_work_mem |
Low | High | 64MB-2GB (for vacuum, index creation) | Medium |
max_connections |
High | Low | 100-500 (use a pooler for more) | High |
checkpoint_completion_target |
High | Medium | 0.7 – 0.9 | Medium |
wal_buffers |
High | Low | -1 (auto-tuned, up to 16MB) | Low |
This table shows that settings like shared_buffers and work_mem have a huge effect on performance for both transactional and analytical systems, making them top priorities for tuning. In contrast, wal_buffers is often best left to its automatic setting.
Storage and System-Level Tuning
Beyond memory, the way your data is stored on physical disks is incredibly important. A smart storage setup can really open up your I/O throughput. Some established practices include:
- Separating Files: Put your transaction logs (like the WAL in PostgreSQL) on a different, fast physical disk from your main data files. Logs are written sequentially, so separating them stops this activity from clashing with the random read/write patterns of your data tables.
- Choosing the Right Filesystem: Pick a filesystem that’s known to work well with databases. For instance, XFS is frequently recommended because of how well it handles large files.
- Considering RAID Levels: Your choice of RAID level is a balance between speed, data safety, and cost. RAID 10 is a popular option for high-performance databases because it provides great read and write speeds along with good redundancy.
These tweaks are often part of a larger strategy. For example, if you’re moving to a new system, it’s best to apply these optimisations from day one. If you’re planning such a move, you might find our guide on data migration best practices useful for ensuring performance is a core part of the plan, not an afterthought. Making these adjustments can bring about real, measurable improvements, often giving you a better result than just throwing more expensive hardware at the problem.
Advanced Strategies for Maximum Performance Gains
So, you’ve done the usual checks. Your queries are tight, your indexes are tuned, and you’ve adjusted all the standard configurations. But you’re still chasing more speed. What’s next? It’s time to look beyond the standard playbook and explore the advanced database performance tuning strategies that seasoned DBAs turn to when they need to squeeze every last drop of performance from their systems. These methods often require a closer look at your database’s inner workings, but they can produce big results where simpler fixes have hit a wall.
One of the most powerful techniques in the arsenal is data partitioning. Picture a huge, multi-terabyte table with years of sales data. Even with the best indexes, pulling up a small date range can feel sluggish because the database has to deal with a gigantic underlying structure. By partitioning this table say, by month or year you’re essentially breaking one massive table into smaller, more manageable physical pieces. When you ask for data from a specific month, the database is smart enough to only scan the relevant partition, completely ignoring the rest. This not only makes queries much faster but also simplifies maintenance like archiving old data.
Digging Deeper: Locking, Transactions, and Caching
As you get into the finer points of tuning, you’ll almost certainly encounter issues with concurrency, where different processes start stepping on each other’s toes. This often leads to optimising how your database handles locks. For example, a very strict transaction isolation level can cause excessive locking, creating bottlenecks where one process is stuck waiting for another. By carefully lowering the isolation level to the minimum your application needs for data consistency (like moving from SERIALIZABLE to READ COMMITTED), you can see a major improvement in throughput, especially in systems with lots of simultaneous users.
Another potent, though database-specific, tool is the materialised view. Unlike a regular view, which is basically just a saved query, a materialised view stores the pre-calculated result of a query as its own physical table. For those complex analytical reports that join several large tables, running the heavy lifting once and storing the results can turn a dashboard that takes minutes to load into one that pops up almost instantly. The trade-off is that the data in the view can get out of date and needs a refresh schedule.
The image below gives a simple picture of the database tuning process. It’s often a continuous feedback loop of monitoring what’s happening and making adjustments.
This cycle shows that advanced tuning isn’t a one-and-done task. It’s an ongoing process of refinement based on how your system is actually being used.
Taking Advantage of Parallelism and Compression
Modern databases are built to use multiple CPU cores through parallel processing, but this feature isn’t always set up for best performance right out of the box. Adjusting parameters that control how and when the database uses parallelism for large queries can give you a huge speed boost. You can essentially encourage the optimiser to chop up a big, complicated query into smaller pieces that run at the same time across different cores. This can drastically cut down execution time for data warehousing and reporting. For those managing automated pipelines, understanding how these settings interact with your infrastructure is vital. You might find our guide on optimising AWS CodePipeline for performance and cost useful for related ideas.
Finally, don’t forget about database compression. For large datasets, compressing your tables and indexes can give you two great benefits:
- It shrinks your storage footprint, which can save you a good amount of money.
- It can boost I/O performance because the database has fewer data blocks to read from the disk. The small amount of CPU power needed to decompress the data is often much less than the time you save on I/O.
These advanced strategies need careful testing and a good understanding of your workload. But when you apply them correctly, they can solve performance issues that seem impossible to fix, making sure your database can grow right alongside your business.
Your Database Performance Action Plan
Knowing how to fix individual database problems is one thing, but achieving long-term performance stability is another. The secret is moving from constantly putting out fires to having a proactive, organised process. This doesn’t mean creating a complex, bureaucratic plan. Instead, it’s about building a simple, clear framework to guide how you approach, prioritise, and track your tuning work. The aim is to establish a repeatable rhythm for managing performance.
This whole process kicks off with setting a solid performance baseline. After all, you can’t improve what you haven’t measured. Capturing key metrics like P95 query latency, transaction throughput, and index usage during normal business hours gives you a ‘gold standard’ to work from. When performance inevitably dips, this baseline becomes your best friend, helping you quickly pinpoint exactly what has changed.
Creating a Sustainable Routine
Once your baseline is established, it’s time to build a maintenance routine you can actually stick with. This isn’t about obsessively tweaking settings every day; it’s about setting up regular, scheduled health checks. The most important part is to document this routine and share it with your team to ensure everyone is on the same page.
A practical routine might look something like this:
- Weekly Performance Reviews: A quick glance at your main monitoring dashboards. Are you seeing any worrying trends in query latency or throughput? Have any new, slow queries popped up since last week?
- Monthly Index Audits: Run scripts to identify unused or redundant indexes. These are fantastic quick wins. Removing them cuts down on write overhead and storage costs without any negative effect on your read performance.
- Quarterly Configuration Checks: Take a moment to review your most critical configuration settings. Maybe your workload has changed significantly, justifying a tweak to your memory allocation or connection pool settings.
Prioritisation and Escalation
Let’s be realistic: not all performance issues are urgent. A solid action plan needs a clear way to prioritise what gets fixed first. I find a simple but effective method is to grade issues based on their impact and effort. A high-impact, low-effort fix like adding a single missing index that’s causing a major slowdown should always jump to the top of your to-do list.
Finally, write everything down. Keep a running log of the changes you make, the thinking behind them, and the results you measured. This not only creates an invaluable knowledge base for your team but also clearly shows the business value of your efforts. This organised approach stops performance issues from turning into full-blown crises and keeps your database infrastructure running smoothly as your organisation expands.
Looking to build a high-performance cloud infrastructure without the operational headache? The expert team at Signiance Technologies can help you design and manage a cloud environment built for speed, scalability, and security.