Maintaining a high-performing, resilient IT infrastructure is critical for business continuity and growth. From local servers and network devices to complex, multi-cloud ecosystems, the stability of these systems directly impacts your organisation’s revenue and user satisfaction. Without clear visibility, identifying the root cause of a slowdown or outage can feel like searching for a needle in a haystack. This is the core problem that modern infrastructure monitoring tools are designed to solve. They provide the necessary observability to detect, diagnose, and resolve issues before they escalate.
This comprehensive guide is built to help you navigate this crowded market and select the right solution for your specific needs. We move beyond generic feature lists to provide a detailed, side-by-side analysis of the top 12 platforms available today. For each tool, you will find an in-depth review covering its key features, ideal use cases, pricing structures, and a candid assessment of its pros and cons. We also include real-world implementation considerations, screenshots of the user interface, and direct links to help you evaluate each option thoroughly.
Whether you’re a startup managing a lean tech stack, a DevOps team at a large enterprise, or a cloud architect designing a new environment, this resource will equip you with the practical insights needed to make an informed decision. Our goal is to simplify your selection process, helping you find a tool that not only monitors your systems but also provides the actionable intelligence required to optimise them for peak performance and reliability.
1. Paessler PRTG Network Monitor
Paessler PRTG Network Monitor is a robust, all-in-one solution renowned for its sensor-based approach to infrastructure monitoring. Rather than requiring complex configurations or multiple add-ons, PRTG bundles everything needed to monitor your entire IT landscape, from network devices and traffic to servers, virtual machines, and applications. This unified methodology makes it one of the most comprehensive out-of-the-box infrastructure monitoring tools available.
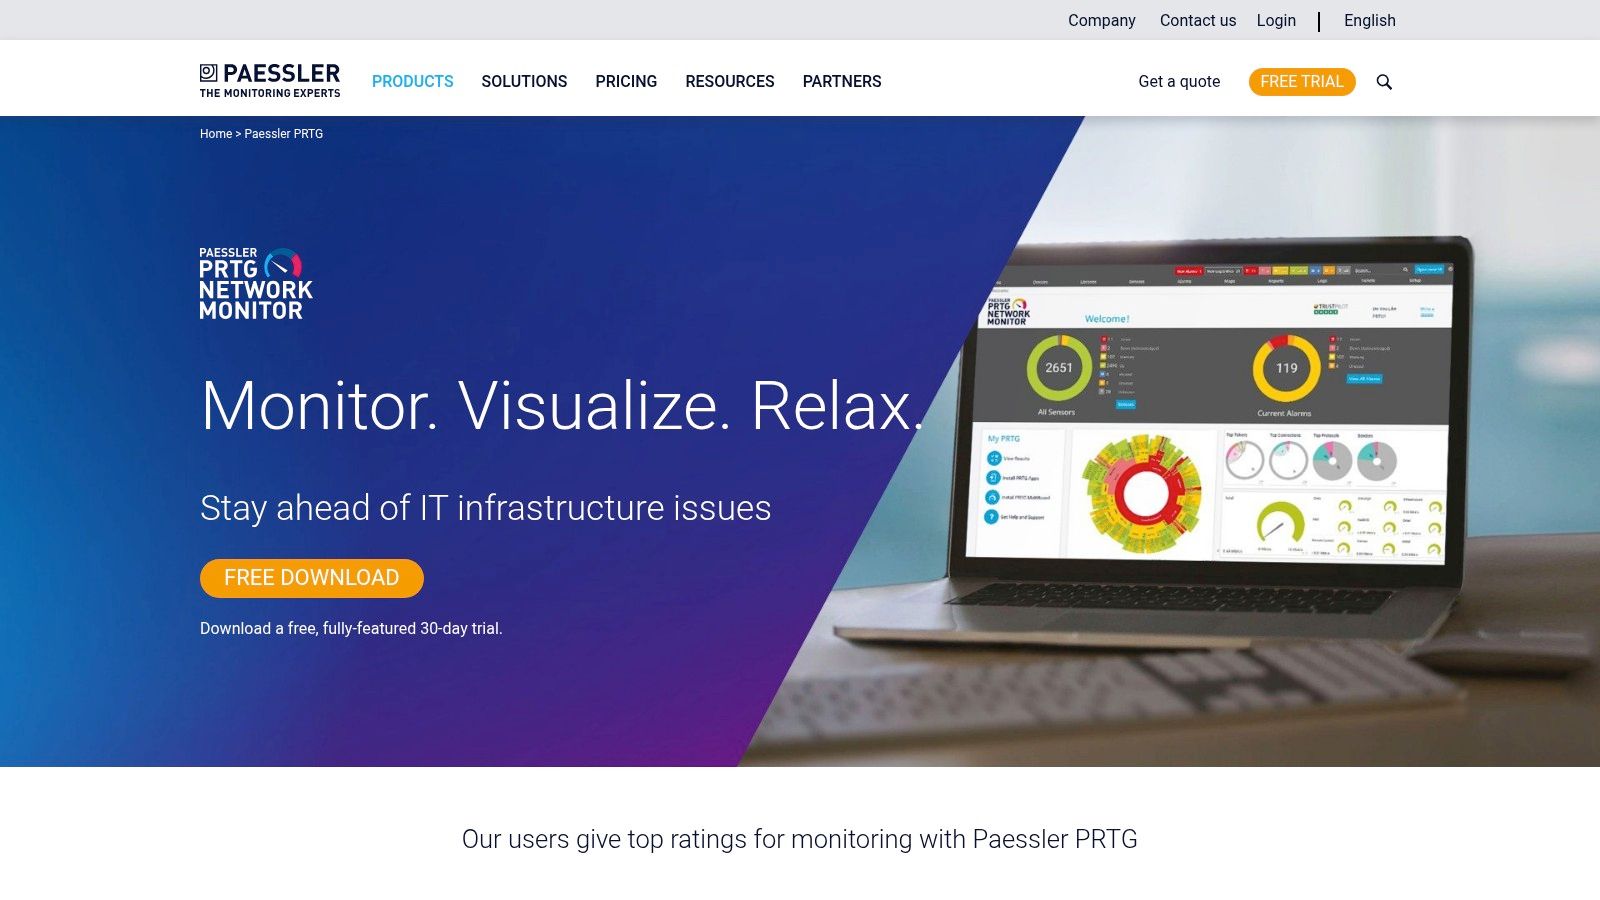
The platform’s strength lies in its extensive library of over 250 pre-configured sensors, which support common protocols like SNMP, WMI, and SSH. This allows for quick deployment and immediate visibility into critical metrics. Its user-friendly, map-based interface provides a clear visual representation of your network’s health, making it highly accessible even for teams with limited monitoring experience. While its Windows-centric architecture might be a limitation for some, its powerful capabilities and ease of use secure its top spot.
Key Details & Features
| Feature | Description |
|---|---|
| Monitoring Approach | Sensor-based; includes over 250 pre-configured sensors for various devices and applications. |
| Visualisation | Highly customisable dashboards and real-time maps for network topology and status visualisation. |
| Alerting | Flexible alerting system via email, SMS, push notifications, and integration with ticketing systems. |
| High Availability | Offers a cluster failover solution to ensure continuous monitoring without service interruption. |
| Pricing Model | Perpetual licence based on the number of sensors. A free version is available for up to 100 sensors. |
Practical Use Case
A mid-sized e-commerce company can use PRTG to monitor the entire user journey infrastructure. They can deploy sensors to track web server response times (IIS/Apache), database query performance (SQL), and network latency between their application servers and payment gateways. This provides a holistic view, enabling the IT team to proactively identify bottlenecks during peak shopping seasons before they impact customer experience. For more insights on this approach, explore how PRTG integrates with larger strategies in infrastructure automation.
- Pros: Intuitive setup, comprehensive feature set without plugins, highly scalable.
- Cons: Sensor-based pricing can become expensive for large infrastructures, primarily runs on Windows.
- Website: https://www.paessler.com/prtg
2. ManageEngine OpManager Plus
ManageEngine OpManager Plus delivers a powerful, unified approach to real-time IT infrastructure monitoring. It consolidates network, server, and application management into a single, cohesive console, making it one of the most integrated infrastructure monitoring tools for organisations seeking end-to-end visibility. The platform excels at simplifying complex environments by providing deep insights without the need to juggle multiple disparate solutions.
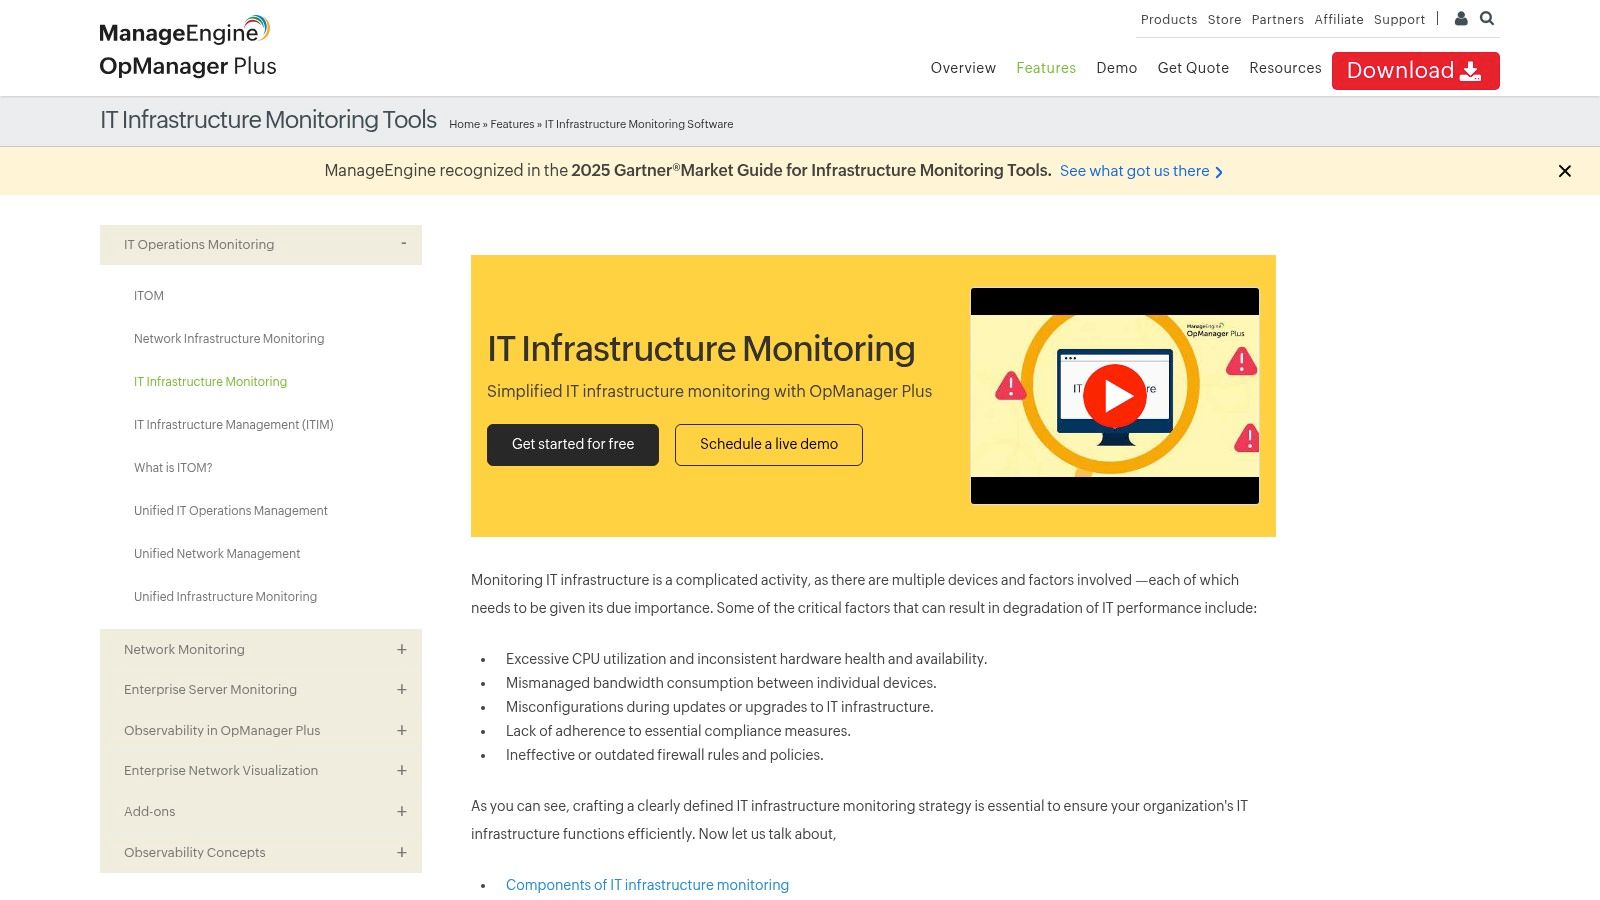
Its strength is its agentless monitoring capability, leveraging standard protocols like SNMP and WMI, combined with an extensive library of over 11,000 device templates. This ensures rapid device discovery and configuration, drastically reducing setup time. The platform’s impressive visualisation tools, including business-level dashboards and 3D datacenter views, provide network administrators with an intuitive way to identify and resolve issues quickly. While the initial configuration can feel complex due to its vast feature set, the long-term operational efficiency it provides is a significant advantage.
Key Details & Features
| Feature | Description |
|---|---|
| Monitoring Approach | Agentless monitoring using protocols like SNMP and WMI; includes over 11,000 device templates. |
| Visualisation | Comprehensive dashboards, network topology maps, and unique 3D datacenter views for at-a-glance status. |
| Automation | Advanced workflow automation for fault management, alerting, and routine troubleshooting tasks. |
| Unified Console | Integrates network, server, firewall, bandwidth, and configuration management in one platform. |
| Pricing Model | Licence-based on the number of devices. A free edition is available for up to three devices. |
Practical Use Case
An enterprise IT department can leverage OpManager Plus to oversee a hybrid infrastructure spanning on-premise data centres and public cloud services. They can use its 3D datacenter view to visually monitor physical server health while simultaneously tracking virtual machine performance in AWS or Azure. The automation workflows can be configured to automatically restart a failed service or execute a backup script when certain thresholds are breached, improving Mean Time To Resolution (MTTR). This aligns with broader strategies for DevOps configuration management by ensuring consistent operational control.
- Pros: Comprehensive all-in-one monitoring, extensive visualisation aids, highly scalable for large enterprises.
- Cons: Initial setup can be complex, some advanced features may require additional licensing.
- Website: https://www.manageengine.com/it-operations-management/it-infrastructure-monitoring.html
3. Zabbix
Zabbix stands out as a powerful, enterprise-grade open-source solution for infrastructure monitoring. It offers immense flexibility, capable of monitoring everything from servers and network devices to applications and cloud services in real-time. Unlike many commercial tools that gatekeep features behind tiered plans, Zabbix provides a complete, unified platform at no cost, making it one of the most comprehensive free infrastructure monitoring tools available for organisations of any scale.

Its strength lies in its high degree of customisation and scalability. Zabbix utilises a combination of agent-based and agentless monitoring, supporting protocols like SNMP, IPMI, and JMX to collect a vast range of metrics. The auto-discovery feature is particularly useful for dynamic environments, as it automatically detects and starts monitoring new network devices. While its powerful nature comes with a steeper learning curve and a user interface that can feel less modern, its robust capabilities and strong community support make it a top choice for teams needing deep control.
Key Details & Features
| Feature | Description |
|---|---|
| Monitoring Approach | Agent-based and agentless monitoring with extensive protocol support for deep data collection. |
| Visualisation | Fully customisable dashboards, graphs, network maps, and slideshows for tailored data representation. |
| Alerting | Granular, scriptable alerting with multiple delivery channels and escalation rules. |
| Scalability | Designed for large environments; can be scaled horizontally using Zabbix proxies to monitor thousands of devices. |
| Pricing Model | Completely free and open-source. Optional paid technical support and training services are available. |
Practical Use Case
A large telecommunications company can leverage Zabbix to monitor its extensive network infrastructure spread across multiple data centres. Using Zabbix proxies in each location, the central Zabbix server can efficiently collect performance metrics from thousands of routers, switches, and servers without overwhelming the network. The team can configure complex triggers to detect subtle performance degradation in network links or high CPU usage on core routers, ensuring service-level agreement (SLA) compliance and preventing widespread outages.
- Pros: Free and open-source with a vibrant community, highly customisable, excellent scalability for large infrastructures.
- Cons: Has a significant learning curve, the user interface feels dated compared to newer tools.
- Website: https://www.zabbix.com/
4. Nagios XI
Nagios XI is an enterprise-grade server and network monitoring software that builds upon the proven, open-source Nagios Core engine. It provides comprehensive monitoring of applications, services, operating systems, network protocols, and system metrics. As one of the most established infrastructure monitoring tools, its strength lies in its profound extensibility and reliability, having been battle-tested in countless IT environments over many years.
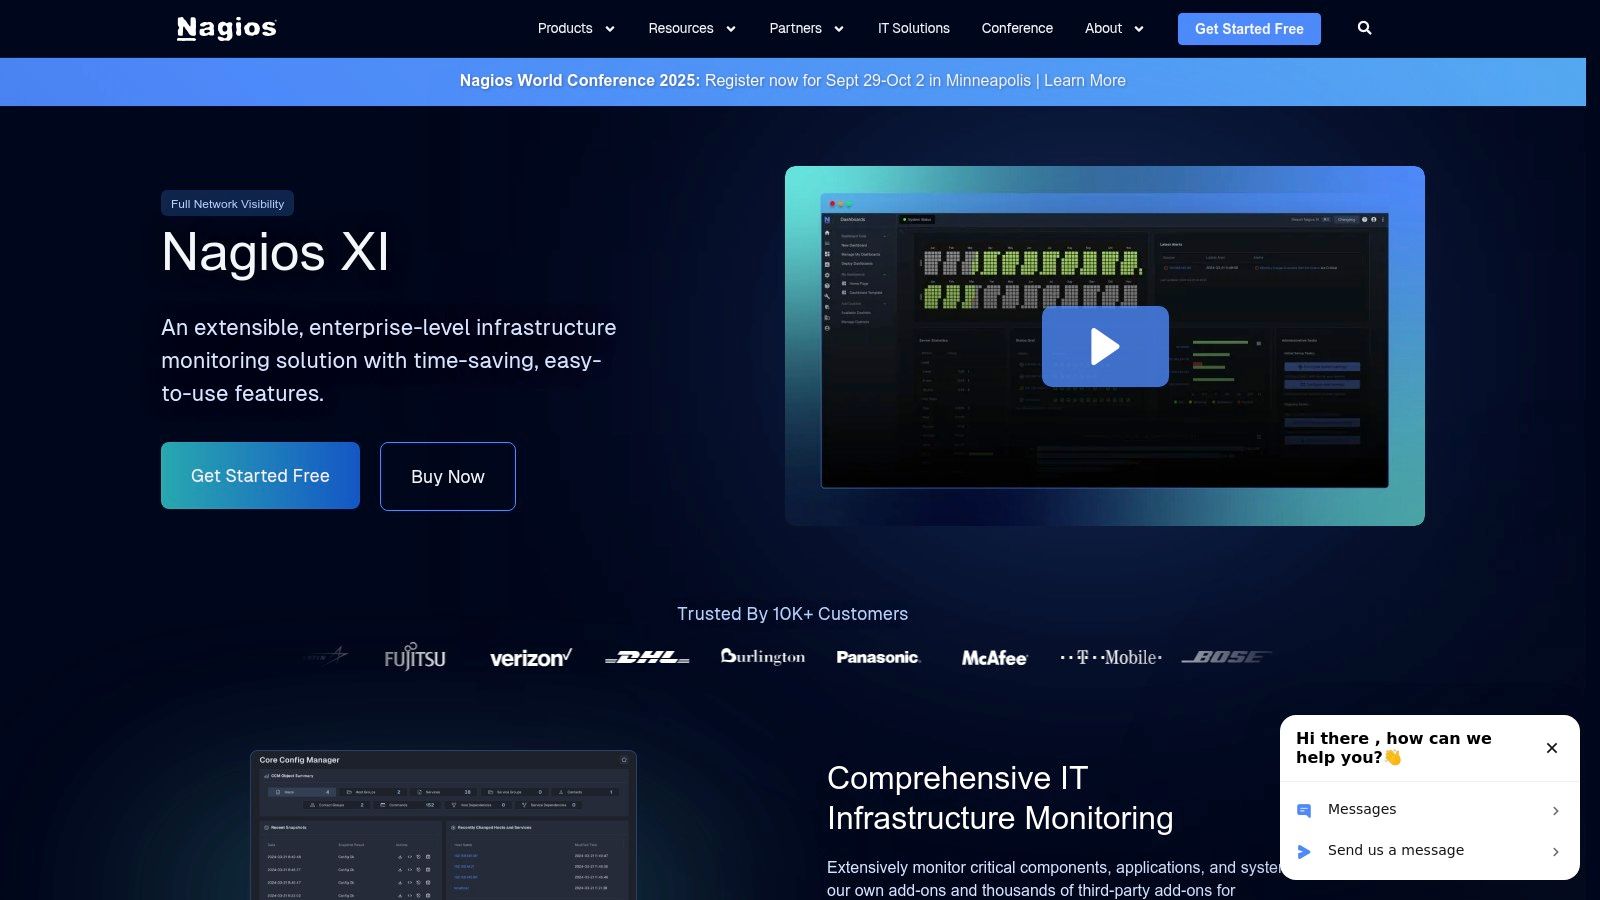
The platform offers powerful backend capabilities, including capacity planning graphs, multi-tenant features for service providers, and configuration wizards to simplify the setup process. While its user interface might feel dated compared to more modern competitors, its flexibility is nearly unmatched, thanks to an extensive library of community-developed plugins. This makes Nagios XI a highly adaptable choice for organisations with unique monitoring needs or those that value deep customisation over out-of-the-box simplicity.
Key Details & Features
| Feature | Description |
|---|---|
| Monitoring Approach | Agent-based and agentless monitoring using Nagios Core engine, supporting a vast array of system checks. |
| Visualisation | Customisable dashboards, advanced graphs, and reporting tools for performance and availability analysis. |
| Alerting | Advanced alert routing, escalations, and notifications via email, SMS, and third-party integrations. |
| Extensibility | Massive ecosystem of thousands of community-built plugins and add-ons to monitor almost any device or service. |
| Pricing Model | Licence-based on the number of nodes (hosts) monitored. Standard and Enterprise editions are available. |
Practical Use Case
An established financial institution can leverage Nagios XI to monitor its complex, hybrid infrastructure. They can use its configuration wizards to quickly set up monitoring for legacy on-premise servers and network hardware, while simultaneously using custom plugins to track the performance of bespoke trading applications. The multi-tenancy feature allows the central IT team to provide dedicated monitoring views to different business units, ensuring security and relevance, while advanced reporting helps in generating compliance documentation for regulatory audits.
- Pros: Proven reliability with a long history, highly extensible through plugins, strong community and commercial support.
- Cons: The user interface can be less intuitive than newer tools, and initial configuration may be complex for large environments.
- Website: https://www.nagios.com/products/nagios-xi/
5. Datadog
Datadog is a modern, cloud-native monitoring and analytics platform that provides comprehensive observability across the entire technology stack. It excels at unifying metrics, traces, and logs from applications, servers, databases, and third-party services into a single, cohesive view. This SaaS-based approach makes it one of the most powerful and scalable infrastructure monitoring tools, especially for organisations with dynamic cloud or hybrid environments.
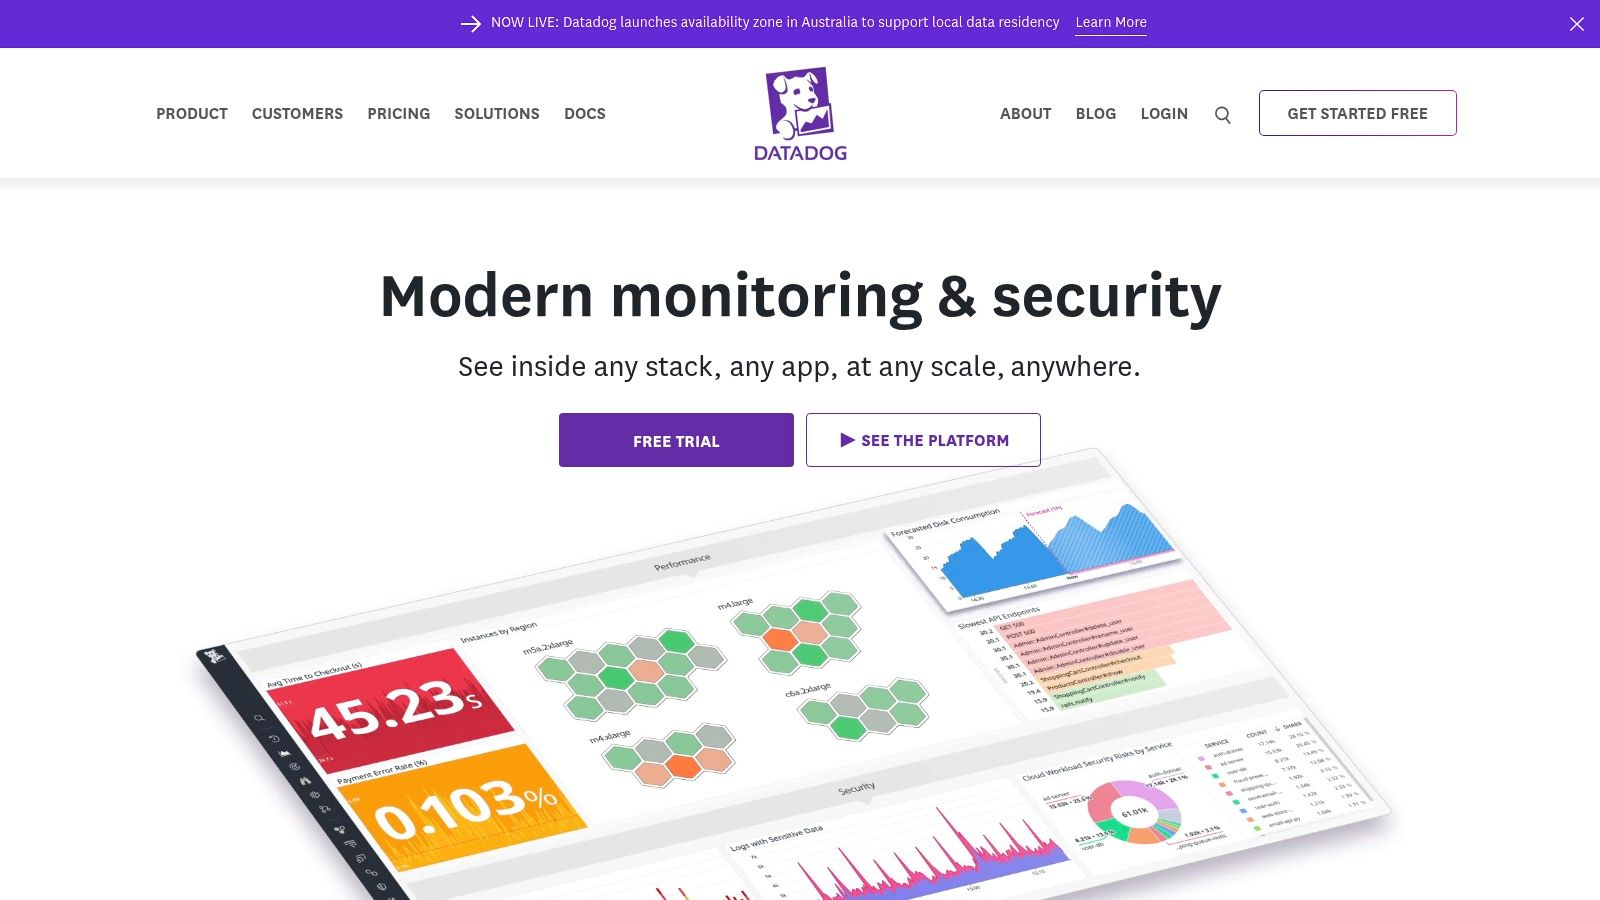
The platform’s key differentiator is its seamless integration of infrastructure monitoring with application performance monitoring (APM) and log management. With over 700 vendor-supported integrations, teams can quickly start collecting data from virtually any source. Its intuitive, drag-and-drop dashboards and powerful query language allow for deep analysis and correlation, helping engineers move from detecting an issue to identifying its root cause with remarkable speed.
Key Details & Features
| Feature | Description |
|---|---|
| Monitoring Approach | A unified SaaS platform for metrics, traces, and logs, providing full-stack observability. |
| Visualisation | Highly customisable, real-time dashboards with drag-and-drop widgets and advanced graphing. |
| Alerting | Machine learning-based alerting (e.g., anomaly detection) and standard threshold-based alerts. |
| Integrations | Extensive library with over 700 integrations for popular cloud providers, databases, and services. |
| Pricing Model | Modular, subscription-based pricing per host, per GB of logs, or other usage metrics. |
Practical Use Case
A SaaS company running a microservices architecture on Kubernetes can leverage Datadog to gain complete visibility into its complex environment. They can monitor container health, track resource utilisation per pod, and trace requests as they travel across different services. By correlating infrastructure metrics with application traces, developers can pinpoint performance degradation in a specific microservice before it impacts end-users. This level of detail is a core benefit, and you can discover more about this synergy in application performance monitoring.
- Pros: Comprehensive monitoring in a single platform, user-friendly interface, excellent for dynamic and cloud-native environments.
- Cons: Pricing can become expensive and complex as infrastructure and data volume scale, some advanced features may require additional configuration.
- Website: https://www.datadoghq.com/
6. Dynatrace
Dynatrace positions itself as a software intelligence platform, moving beyond traditional monitoring with a heavy emphasis on AI-powered automation and full-stack observability. It automatically discovers, maps, and monitors entire hybrid-cloud ecosystems, from infrastructure and microservices to application performance and user experience. This unified, AI-driven approach provides deep, actionable insights with minimal manual configuration, making it a powerful choice for complex, dynamic environments.
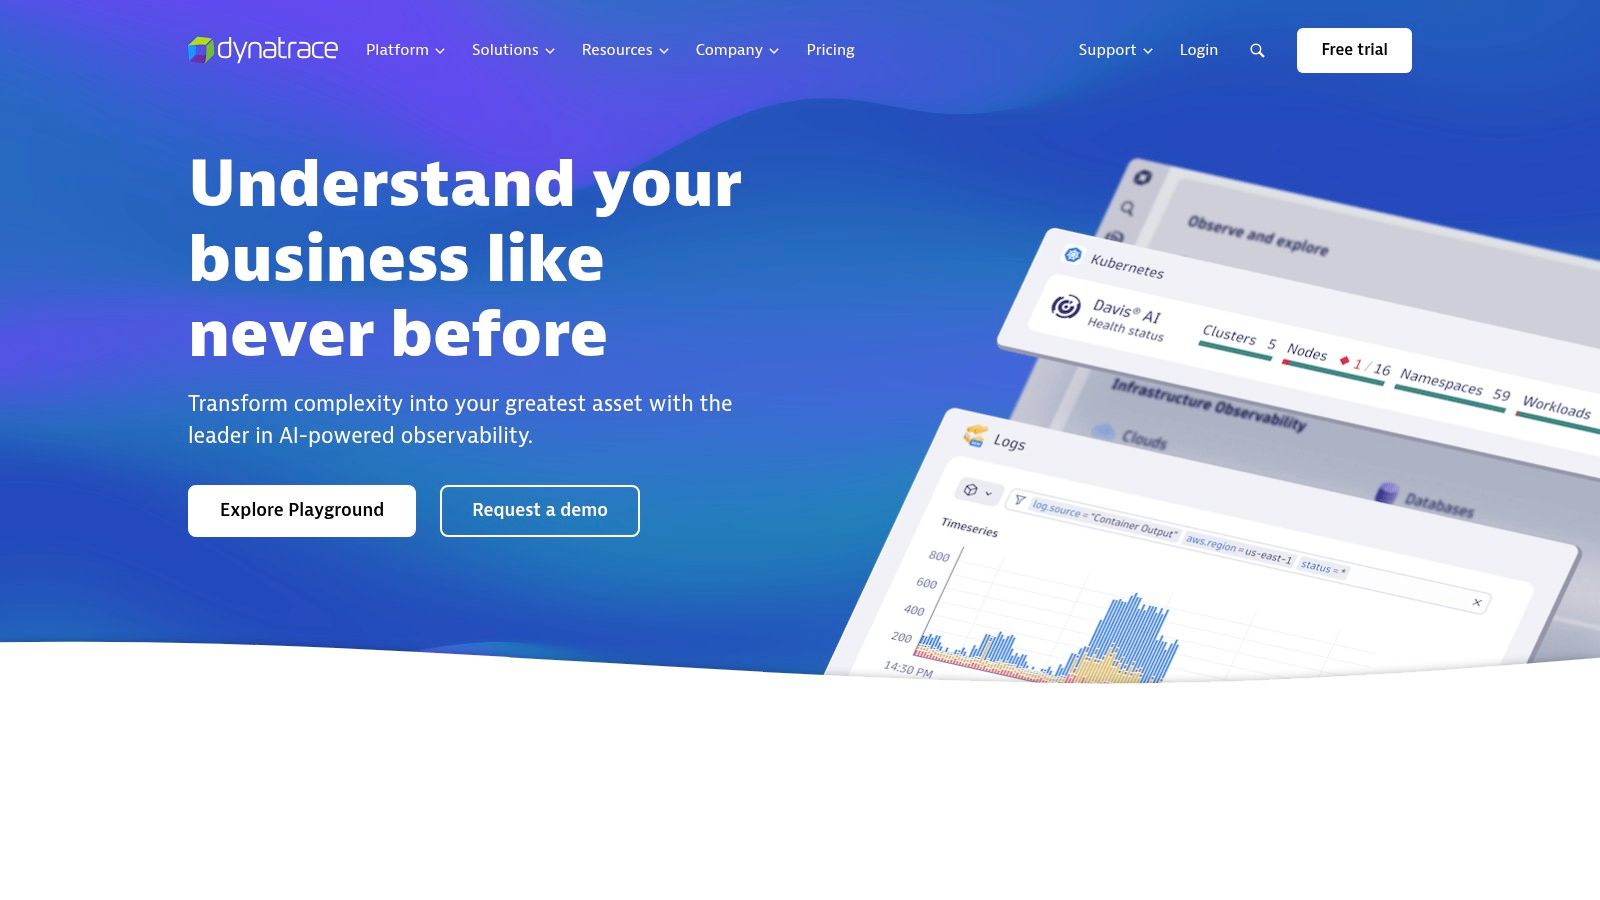
The platform’s core strength is its AI engine, Davis®, which automates root-cause analysis, anomaly detection, and performance trending. Instead of just presenting data, Dynatrace provides precise answers, significantly reducing the mean time to resolution (MTTR) for DevOps and SRE teams. Its comprehensive support for cloud-native technologies like Kubernetes and serverless functions makes it one of the most forward-thinking infrastructure monitoring tools for enterprises embracing digital transformation.
Key Details & Features
| Feature | Description |
|---|---|
| Monitoring Approach | All-in-one platform with automatic, full-stack observability from user experience to infrastructure. |
| AI Engine (Davis®) | Provides deterministic AI-powered root cause analysis, anomaly detection, and predictive insights. |
| Automation | Automates discovery, instrumentation, and dependency mapping across the entire technology stack. |
| Cloud-Native Focus | Deep monitoring for Kubernetes, containers, microservices, and serverless architectures. |
| Pricing Model | Consumption-based pricing based on hosts, services, and data volume. A free trial is available. |
Practical Use Case
An enterprise financial services company can leverage Dynatrace to ensure the reliability of its customer-facing mobile banking application. Dynatrace’s OneAgent can be deployed across their hybrid environment, automatically monitoring everything from the underlying Kubernetes clusters in AWS to the application-level APIs and database transactions. When a performance degradation is detected, Davis® can pinpoint the exact root cause, such as a faulty microservice or a slow database query, allowing the DevOps team to remediate the issue before it impacts a large number of users.
- Pros: Highly automated with minimal manual configuration, powerful AI for root cause analysis, excellent for large and complex cloud environments.
- Cons: Premium pricing model may be costly, can be overly complex for smaller organisations with simple needs.
- Website: https://www.dynatrace.com/
7. Site24x7
Site24x7 by Zoho Corp offers a powerful, all-in-one monitoring solution that covers the full IT stack, from websites and servers to cloud environments and applications. It is particularly well-regarded for its cloud-centric approach, providing deep visibility into AWS, Azure, and GCP services alongside traditional on-premise infrastructure. This unification makes it one of the most versatile cloud and infrastructure monitoring tools, appealing to businesses undergoing digital transformation.
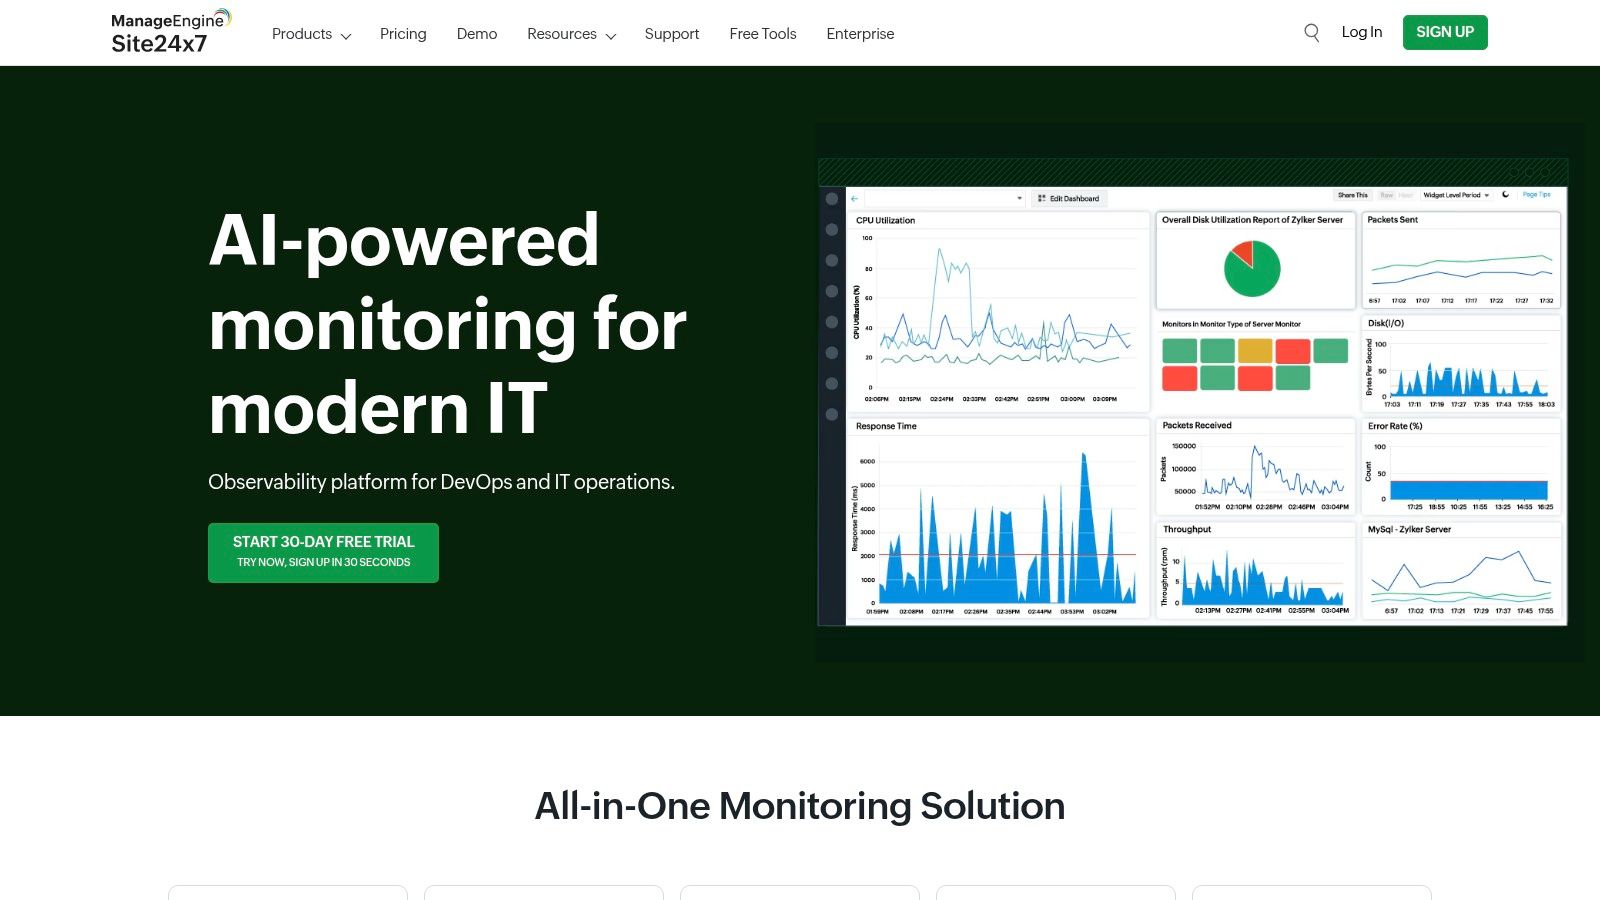
The platform distinguishes itself with a user-friendly interface and a quick setup process, allowing teams to gain insights rapidly. Its automated discovery and mapping features simplify the onboarding of network devices, while its extensive integration capabilities ensure it fits smoothly into existing DevOps toolchains. While some advanced customisation options are reserved for higher-tier plans, its balance of comprehensive features, ease of use, and flexible pricing makes it a strong contender for small to medium-sized enterprises.
Key Details & Features
| Feature | Description |
|---|---|
| Monitoring Approach | All-in-one agent-based and agentless monitoring for websites, servers, cloud, network, and applications. |
| Visualisation | Customisable dashboards, network topology maps, and comprehensive reports for performance analysis. |
| Alerting | Multi-channel alerts via email, SMS, voice calls, and push notifications, with third-party tool integrations. |
| Cloud Support | Extensive, native support for AWS, Azure, and GCP, including over 100 service integrations for AWS alone. |
| Pricing Model | Subscription-based with flexible tiers based on monitor count. A free-forever plan is available. |
Practical Use Case
A growing SaaS startup can leverage Site24x7 to monitor its entire multi-cloud architecture. The team can track user experience with real user monitoring (RUM), monitor the health of its containerised applications on Kubernetes, and keep an eye on its AWS Lambda and Azure Functions performance. This unified view helps the DevOps team correlate front-end performance issues with back-end infrastructure or cloud service problems, enabling faster troubleshooting and ensuring high service availability for its customers.
- Pros: Comprehensive monitoring in a single platform, flexible pricing suitable for various business sizes, user-friendly interface with quick setup.
- Cons: Some advanced features may require higher-tier plans, limited customisation compared to some competitors.
- Website: https://www.site24x7.com/
8. Checkmk
Checkmk stands out as a powerful and highly extensible IT monitoring solution, renowned for its hybrid approach that combines the simplicity of autodiscovery with deep, granular configuration options. It provides comprehensive coverage across servers, networks, cloud environments, containers, and applications. The platform is built on a core philosophy of efficiency, delivering high performance with minimal resource consumption, making it one of the most scalable infrastructure monitoring tools for complex, large-scale environments.
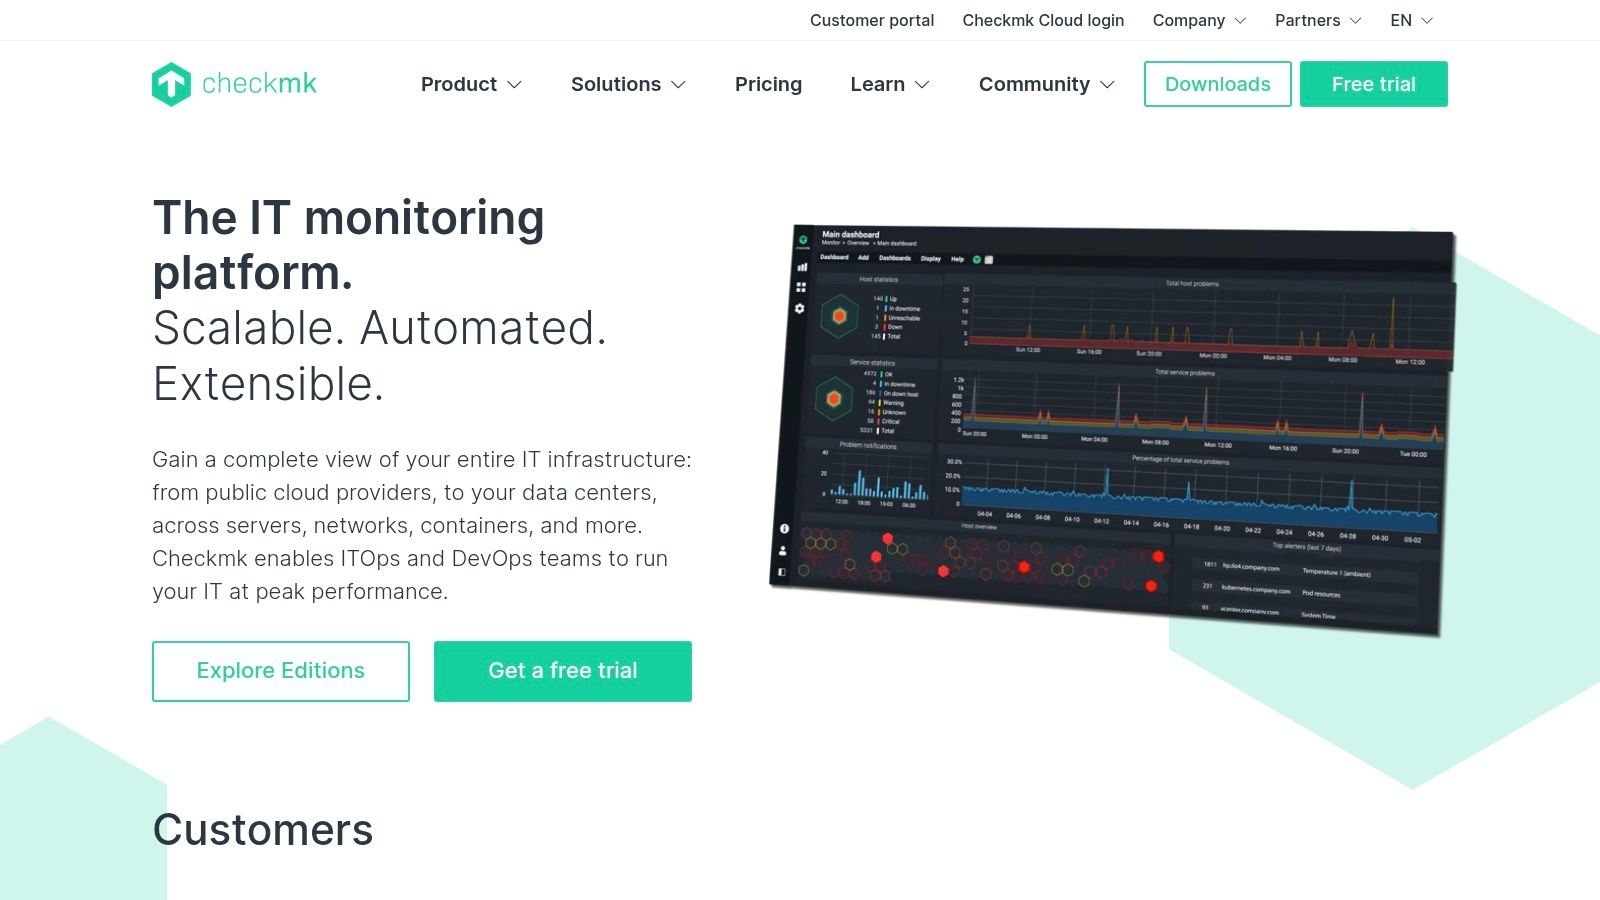
Its key differentiator is the vast library of over 2,000 official plug-ins, which enables it to monitor almost any piece of hardware or software out of the box. Checkmk’s rule-based configuration system allows administrators to manage thousands of hosts and services with a handful of rules, dramatically simplifying maintenance. While its user interface is more functional than flashy and the initial learning curve can be steep for newcomers, its raw power and customisation capabilities are unmatched.
Key Details & Features
| Feature | Description |
|---|---|
| Monitoring Approach | Hybrid agent-based and agentless monitoring with automatic service discovery. |
| Extensibility | Features over 2,000 built-in plug-ins covering a vast range of technologies and vendors. |
| Configuration | Rule-based configuration for efficient management and automation of large-scale deployments. |
| Scalability | Architected for high performance and low resource usage, capable of monitoring millions of services. |
| Pricing Model | Available as a free, open-source Raw Edition and a subscription-based Enterprise Edition. |
Practical Use Case
An enterprise data centre can leverage Checkmk to gain unified visibility over its heterogeneous infrastructure. Using its agent-based monitoring, they can track detailed OS-level metrics (CPU, RAM, disk I/O) on thousands of Linux and Windows servers. Simultaneously, its agentless, API-based plug-ins can poll network switches, storage arrays (e.g., NetApp), and VMware vSphere clusters. This consolidation into a single dashboard provides a holistic health overview, while rule-based alerts can automatically notify specific teams based on device type or severity, streamlining incident response.
- Pros: Highly customisable and extensible, strong community support, efficient performance with minimal resource usage.
- Cons: Initial setup and configuration can be complex, user interface may not feel as modern as some competitors.
- Website: https://checkmk.com/
9. Icinga
Icinga is a powerful, open-source infrastructure monitoring tool that evolved from a fork of the Nagios monitoring system. It is celebrated for its modular architecture, which separates the monitoring core from the web interface and data storage. This design provides exceptional flexibility, allowing DevOps and IT teams to build a monitoring solution that is precisely tailored to their technological stack and operational requirements.
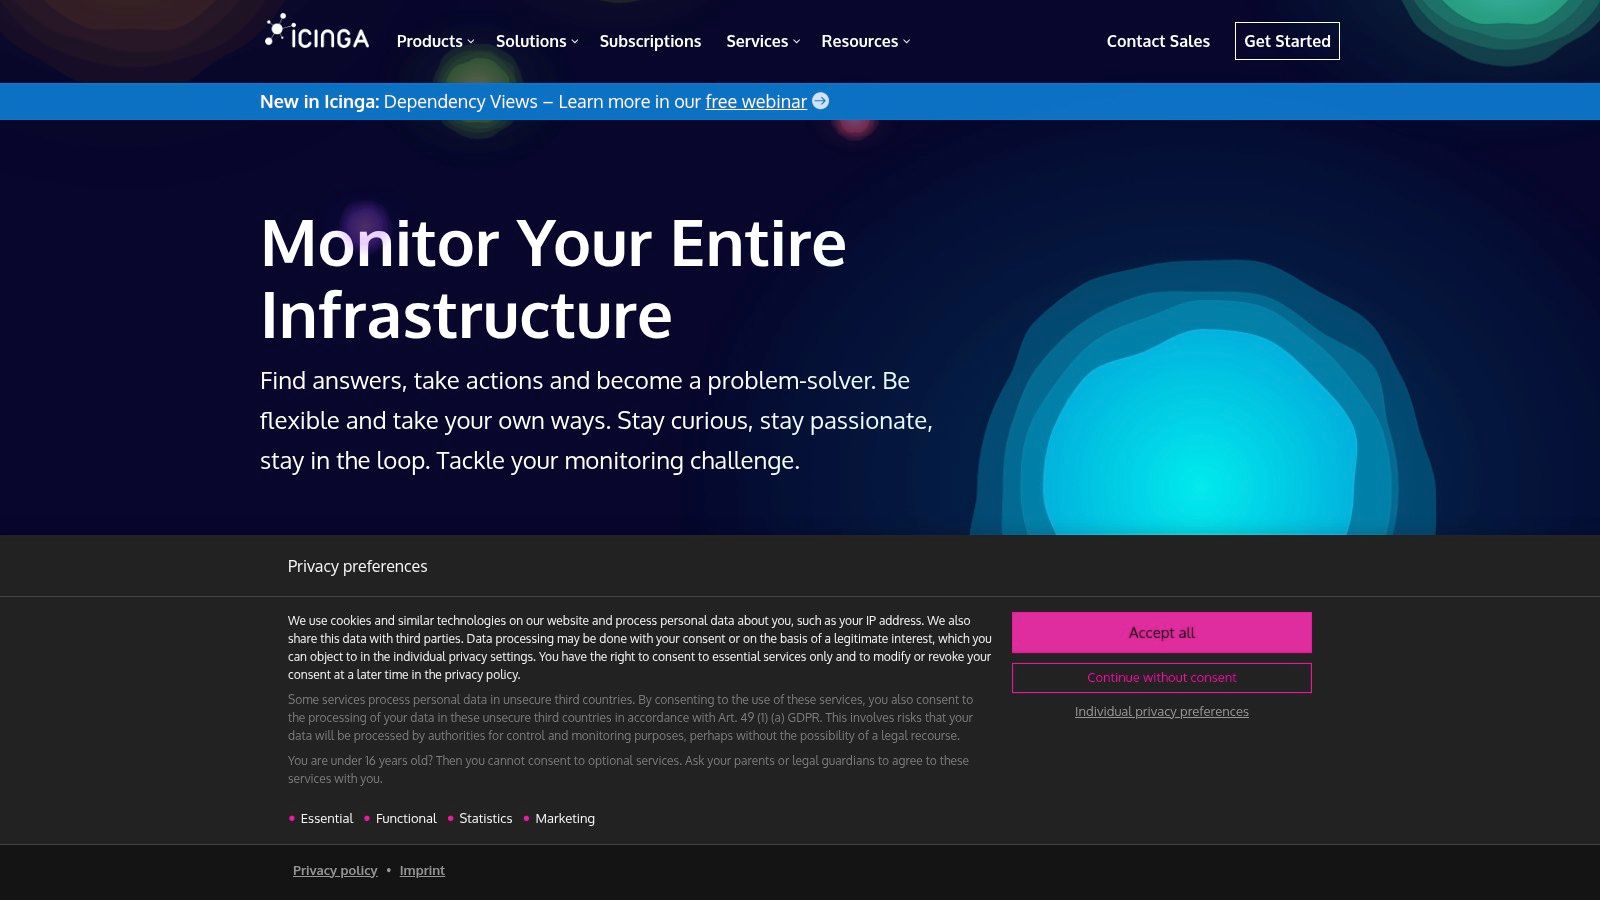
The platform’s key distinction is its commitment to customisation and extensibility. While many infrastructure monitoring tools offer a fixed feature set, Icinga empowers users to extend its capabilities through a vast library of community-driven plugins and integrations. Its robust configuration language allows for complex monitoring logic, making it ideal for large-scale, dynamic environments. Though its steep learning curve and less polished UI can be challenging for newcomers, its raw power and scalability make it a top choice for organisations that prioritise control and adaptability.
Key Details & Features
| Feature | Description |
|---|---|
| Monitoring Approach | A modular core supporting both direct, agentless checks (SNMP, SSH) and agent-based monitoring. |
| Visualisation | Highly customisable dashboards and reporting through the Icinga Web 2 interface, with powerful filtering. |
| Alerting | Rule-based notifications via email, SMS, and integrations with tools like PagerDuty, Slack, and Opsgenie. |
| Scalability | Architected for high availability and distributed monitoring, enabling it to scale across complex environments. |
| Pricing Model | Completely free and open-source. Optional enterprise support and add-ons are available through commercial partners. |
Practical Use Case
A large financial institution with a hybrid-cloud environment can leverage Icinga to create a unified monitoring framework. They can monitor on-premise legacy systems using SNMP checks while deploying the Icinga Agent on modern cloud instances in AWS or Azure. This allows them to apply consistent business-level rules for alerting across their entire infrastructure, ensuring that a critical failure in a mainframe system triggers the same incident response workflow as an issue with a cloud-native microservice.
- Pros: Free and open-source with strong community support, highly customisable, scales effectively for large deployments.
- Cons: Steeper learning curve compared to commercial tools, the user interface can feel less intuitive.
- Website: https://icinga.com/
10. OpenNMS
OpenNMS is an open-source, enterprise-grade network monitoring platform designed for scalability and flexibility. It distinguishes itself by offering a truly free and community-driven alternative to proprietary infrastructure monitoring tools, providing comprehensive event management, performance data collection, and service assurance. The platform is built to manage massive, complex networks, making it a powerful choice for organisations that require deep customisation and control over their monitoring environment without vendor lock-in.
The strength of OpenNMS lies in its robust architecture, which supports extensive protocol monitoring including SNMP, JMX, and HTTP, and its highly configurable event and notification system. While its initial setup and configuration can be considerably more complex than commercial alternatives, and its user interface feels less modern, its power and extensibility are unmatched in the open-source space. It is ideal for experienced teams who need a no-cost, highly adaptable monitoring solution.
Key Details & Features
| Feature | Description |
|---|---|
| Monitoring Approach | Event-driven architecture with automatic service discovery and provisioning. |
| Data Collection | Collects performance data via SNMP, JMX, WMI, and custom collectors for detailed analysis. |
| Event Management | Advanced event correlation and a flexible notification system with customisable workflows. |
| Scalability | Designed with a distributed architecture to monitor tens of thousands of devices from a single instance. |
| Pricing Model | Completely free and open-source. Optional commercial support and services are available via The OpenNMS Group. |
Practical Use Case
A large telecommunications provider can leverage OpenNMS to monitor its vast and distributed network infrastructure. They can use its auto-discovery features to automatically map and monitor new network devices as they come online. The advanced event correlation engine helps the network operations centre (NOC) team reduce alert noise by grouping related events, allowing them to focus on root-cause analysis of service outages rather than being overwhelmed by individual component failures.
- Pros: Free and open-source with strong community backing, highly customisable and extensible, built for large-scale environments.
- Cons: Steep learning curve with a complex initial setup, user interface is less polished than competitors.
- Website: https://www.opennms.org/
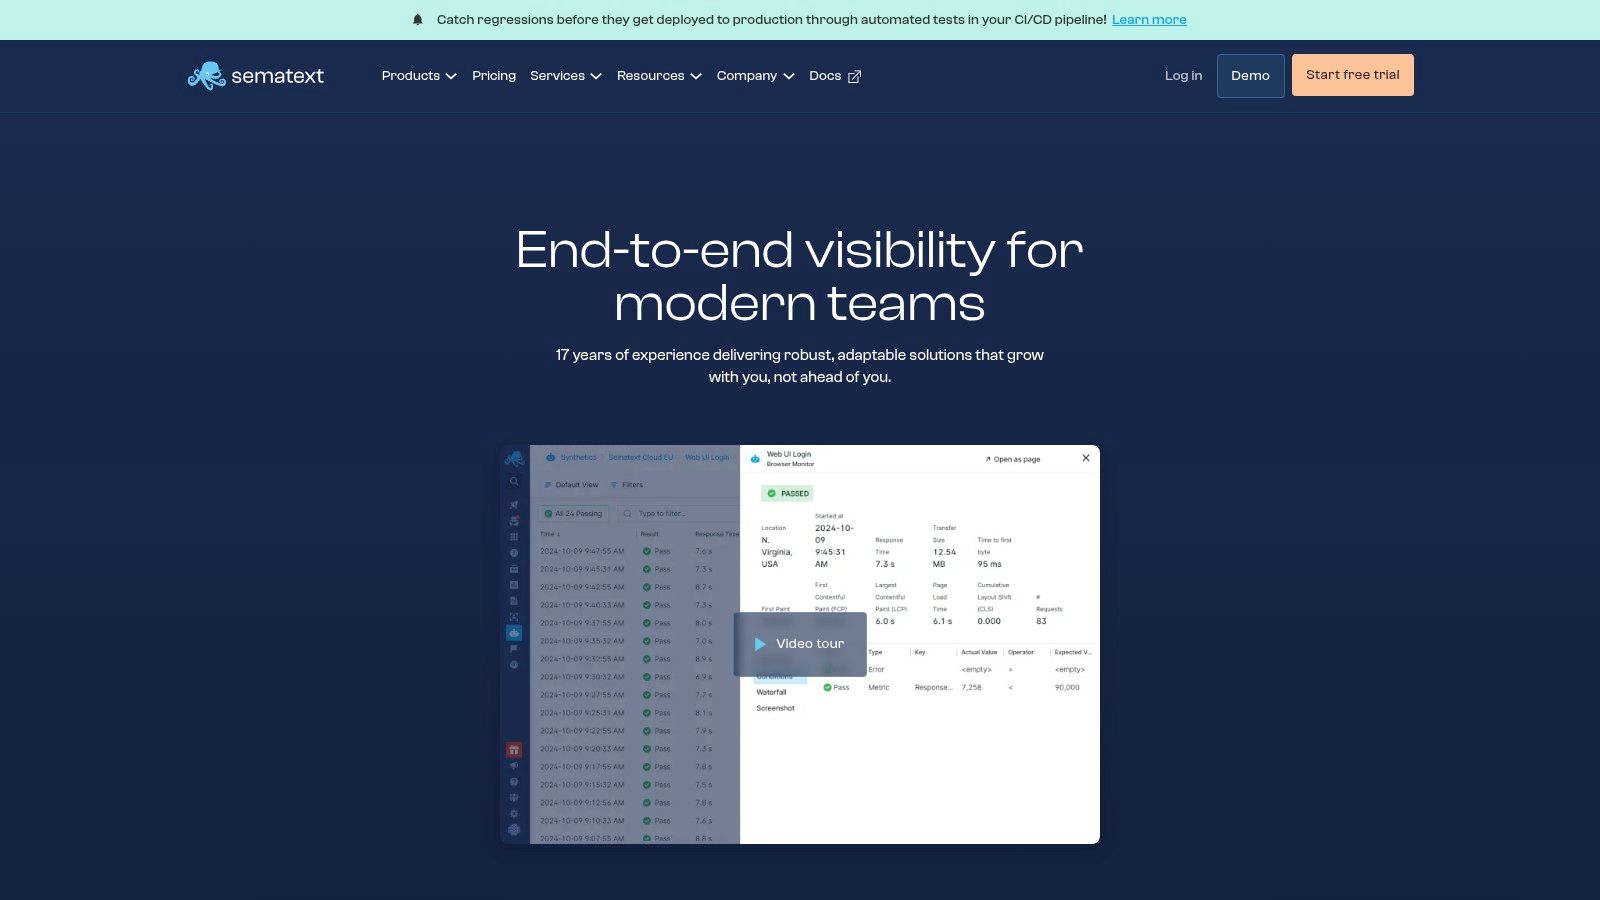
11. Sematext
Sematext stands out as a powerful, unified observability platform, combining infrastructure monitoring, application performance monitoring (APM), and log management into a single, cohesive solution. This integrated approach simplifies the often-fragmented process of tracking system health by correlating metrics, logs, events, and traces in one place. It is particularly effective for modern, dynamic environments built on containers and microservices.
The platform’s strength is its out-of-the-box support for a wide array of technologies, including native integrations for Docker, Kubernetes, and various cloud services. Its user-friendly interface and auto-discovery features enable teams to get up and running quickly, providing immediate visibility without a steep learning curve. Sematext is one of the most versatile infrastructure monitoring tools for teams that need a full-stack view, from server CPU to application-level errors, without juggling multiple services.
Key Details & Features
| Feature | Description |
|---|---|
| Monitoring Approach | Unified platform for logs, metrics, traces, and real user monitoring, providing full-stack observability. |
| Visualisation | Highly customisable dashboards with drag-and-drop widgets and split-screen views for data correlation. |
| Alerting | Anomaly detection and threshold-based alerts with integrations for Slack, PagerDuty, email, and webhooks. |
| Container Support | Extensive, agent-based monitoring for Docker, Kubernetes, and other container orchestration platforms. |
| Pricing Model | Pay-as-you-go model with multiple plan tiers based on data retention, volume, and features. Includes a free tier. |
Practical Use Case
A DevOps team managing a microservices-based application on Kubernetes can leverage Sematext to gain complete operational insight. They can monitor container resource utilisation (CPU/memory), track pod health, and analyse application logs from all services in a single stream. If an API endpoint starts returning errors, the team can immediately correlate performance spikes in the infrastructure metrics with specific error logs, drastically reducing the mean time to resolution (MTTR).
- Pros: All-in-one observability solution, excellent support for containerised environments, intuitive user interface.
- Cons: Advanced features are tied to higher-cost plans, dashboard customisation can be less extensive than some specialised tools.
- Website: https://sematext.com/
12. Better Stack
Better Stack consolidates infrastructure monitoring, logging, and incident management into a single, cohesive platform. It aims to simplify the modern tech stack by offering a beautifully designed, developer-friendly interface that provides real-time insights without a steep learning curve. The platform’s core strength is its unified approach, allowing teams to correlate performance metrics with log data effortlessly, which streamlines the troubleshooting process significantly.
This tool is particularly well-suited for startups and cloud-native teams that prioritise speed and simplicity. Better Stack’s fast, SQL-compatible log management and customisable dashboards make it a formidable competitor among modern infrastructure monitoring tools. It provides the essential visibility needed to maintain system reliability and performance in dynamic environments, all while maintaining a focus on user experience and rapid deployment. Its blend of observability features in one package reduces tool sprawl and operational overhead.
Key Details & Features
| Feature | Description |
|---|---|
| Monitoring Approach | Unified platform combining uptime monitoring, incident management, and log management. |
| Visualisation | Real-time, customisable dashboards that can be built and shared quickly for immediate insights. |
| Log Management | Features fast, SQL-compatible log search and analysis capabilities, integrated directly with monitoring. |
| Integrations | Extensive support for over 100 integrations with popular services like Vercel, Slack, and Datadog. |
| Pricing Model | Tiered subscription model, including a free tier for basic needs and scalable plans for growing teams. |
Practical Use Case
A growing SaaS company can leverage Better Stack to ensure high availability and quick issue resolution for its cloud-based application. The DevOps team can set up uptime monitors for critical API endpoints and configure smart, on-call alerting schedules. When a performance degradation is detected, the on-call engineer receives an alert and can immediately jump into the integrated log management interface to query relevant logs, identifying the root cause within minutes instead of hours. This integrated workflow is crucial for maintaining a high service level agreement (SLA).
- Pros: Comprehensive monitoring in a single platform, flexible pricing suitable for various business sizes, strong community support.
- Cons: Some advanced features require higher-tier plans, limited customisation compared to some competitors.
- Website: https://betterstack.com/
Infrastructure Monitoring Tools Feature Comparison
| Solution | Core Features / Capabilities | User Experience & Quality | Value Proposition | Target Audience | Unique Selling Points |
|---|---|---|---|---|---|
| Paessler PRTG Network Monitor | 250+ sensors, dashboards, alerting, cluster failover | User-friendly, scalable | Moderate to high for large infra | SMBs to Enterprises | All-in-one comprehensive monitoring |
| ManageEngine OpManager Plus | Agentless monitoring, 11K+ templates, automation | Extensive visualization | Additional licensing for advanced | Enterprises | Unified console, automation features |
| Zabbix | Agent-based/agentless, auto-discovery, scalable | Free, customizable | Free, open-source | Tech-savvy SMEs to Enterprises | Open-source flexibility, broad protocol support |
| Nagios XI | Dashboards, multi-tenant, trending graphs | Reliable, extensible | Mid-tier | MSPs, Enterprises | Extensive plugins and commercial support |
| Datadog | Full-stack, log management, 400+ integrations | User-friendly, scalable | Can be expensive at scale | Growing to large businesses | Cloud-based all-in-one observability |
| Dynatrace | AI root cause, full-stack, cloud-native | Highly automated | Premium pricing | Large enterprises | AI-powered insights, automation |
| Site24x7 | Website, server, network, cloud monitoring | Easy setup, mobile apps | Flexible pricing | SMBs to Mid-market | Multi-cloud support, mobile monitoring |
| Checkmk | 2,000+ plugins, agent-based/less, Grafana integration | Customizable, efficient | Free to moderate costs | Large enterprises | Plugin richness, rule-based config |
| Icinga | Modular, customizable, 3rd-party integrations | Open-source, customizable | Free, open-source | Tech-savvy SMEs to Enterprises | Modular architecture |
| OpenNMS | Event mgmt, performance data, scalable | Free, extensible | Free, open-source | Large enterprises | Workflow customization |
| Sematext | Unified logs/metrics/events, Kubernetes support | User-friendly, quick setup | Flexible pricing | SMBs to Mid-market | Unified platform for logs & metrics |
| Better Stack | Real-time monitoring, log analysis, scalable | Easy to use, quick setup | Flexible pricing | SMBs to Mid-market | User-centric, community-supported |
Future-Proofing Your Infrastructure with Strategic Monitoring
Navigating the landscape of modern IT infrastructure demands more than just reacting to problems; it requires a proactive, strategic approach to visibility and control. Throughout this guide, we have explored a diverse array of twelve leading infrastructure monitoring tools, each presenting a unique combination of strengths, weaknesses, and ideal use cases. From the comprehensive, all-in-one suite of Paessler PRTG to the AI-powered, automated ecosystem of Dynatrace and the customisable, open-source power of Zabbix and Icinga, the options are as varied as the infrastructures they are designed to monitor.
The central takeaway is clear: there is no single “best” tool for everyone. The optimal choice is deeply personal to your organisation’s specific context. A lean startup might prioritise the cost-effectiveness and flexibility of an open-source solution like Zabbix, whereas a large enterprise grappling with complex, hybrid-cloud environments may find the extensive automation and deep observability of Datadog or Dynatrace to be indispensable.
Synthesising Your Decision: Key Selection Criteria
Your selection process should be a deliberate exercise in matching a tool’s capabilities to your unique operational realities. As you move from evaluation to decision, anchor your thinking around these critical pillars:
- Scalability and Architecture: Does your infrastructure consist of a few on-premise servers, or a sprawling, multi-cloud, containerised environment? Tools like Checkmk and ManageEngine OpManager Plus excel in hybrid scenarios, while solutions such as Datadog are built with cloud-native principles at their core. Ensure your chosen tool can grow with you, not hold you back.
- Team Skillset and Resources: A powerful tool is only effective if your team can master it. Nagios XI and Zabbix offer immense power but come with a steeper learning curve that demands specialised expertise. Conversely, platforms like Site24x7 and Better Stack are celebrated for their user-friendly interfaces and faster implementation times, making them ideal for teams without dedicated monitoring specialists.
- Total Cost of Ownership (TCO): Look beyond the initial licencing fee. Consider the hidden costs associated with implementation, training, customisation, and ongoing maintenance. Open-source tools like OpenNMS may seem free upfront, but they require significant investment in skilled personnel to configure and manage them effectively.
- Integration and Ecosystem: Modern infrastructure is a complex web of interconnected services. Your monitoring tool must integrate seamlessly with your existing technology stack, from ticketing systems and notification channels to CI/CD pipelines. Assess the breadth and depth of a tool’s available integrations to avoid creating data silos.
From Tool Selection to Strategic Implementation
Once you have selected one of the infrastructure monitoring tools that aligns with your needs, the journey is far from over. Successful implementation is a strategic project, not just a technical task. It involves defining clear monitoring objectives, establishing meaningful alert thresholds to minimise noise, and creating dashboards that provide actionable insights to different stakeholders, from DevOps engineers to business leaders.
The goal is to transform monitoring from a reactive, break-fix activity into a proactive engine for continuous improvement. The right platform, configured correctly, empowers you to identify performance bottlenecks before they impact users, optimise resource utilisation to control costs, and fortify your security posture by detecting anomalous activity. This proactive stance is the cornerstone of building a resilient, high-performing, and secure digital foundation that can adapt to the ever-changing demands of the market.
Implementing a robust monitoring strategy is a foundational step in digital transformation. For organisations looking to build a secure, scalable, and resilient infrastructure based on cloud-native principles, partnering with an expert can accelerate success. Signiance Technologies specialises in designing and managing optimised cloud environments, leveraging best practices to ensure your monitoring strategy delivers maximum value and supports your long-term business growth.